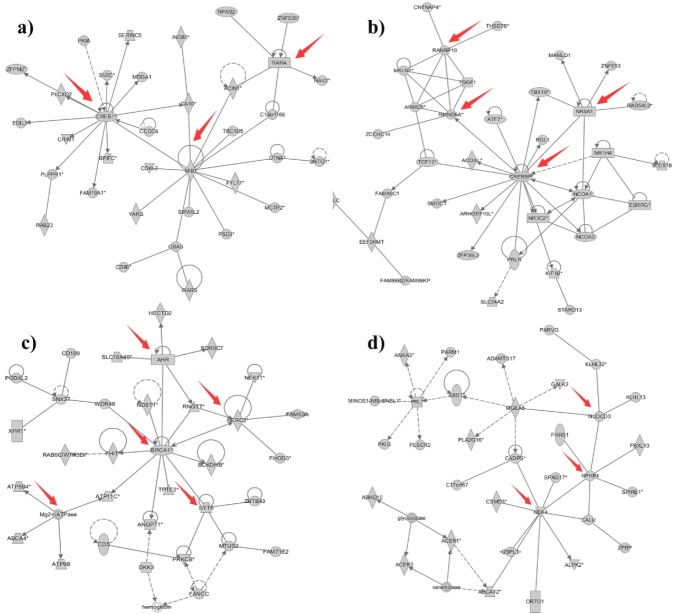
Figure 3.
The detailed networks related to different diseases and functions. (a) Shows the network of genes significantly related to embryonic development; (b) shows the network significantly associated with reproductive system development and function; (c) and (d) show the networks significantly related to lipid metabolism. Solid shapes represent the genes in the original module, hollow shapes represent the genes or biomolecules that were added to the network from the ingenuity pathway analysis database to complete the whole network, solid lines show direct interactions between genes, and dashed lines show indirect interactions between genes.

