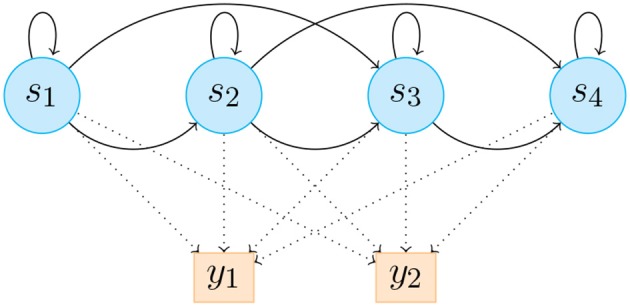
Figure 3.

HHMM illustration consists of 4 states, which emit 2 discrete likelihood estimations y1 and y2. aij is the probability to transition from state si to state sj, and bj(yk) is the probability to emit likelihood yk in state sj. Solid lines represent state transition probabilities aij and dotted lines represent bj(yk).
