Fig. 1.

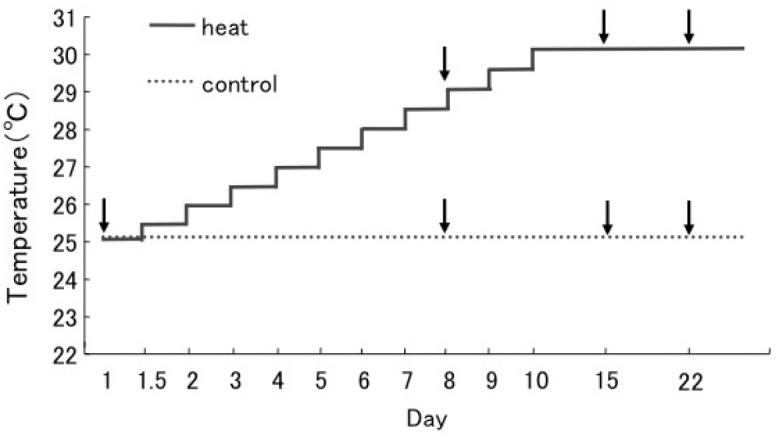
Fig. 1. Schematic representation of the experimental design. In the temperature treatment experiment, the water temperature was gradually increased from 25°C by 0.5°C daily to 30°C (approx. 30°C: the maximum water temperature around Aka Island). We have confirmed that water temperatures in containers were actually increased according to plan. The control set (...line) was maintained at 25°C throughout the experiment. Sampling times are indicated by arrows.
