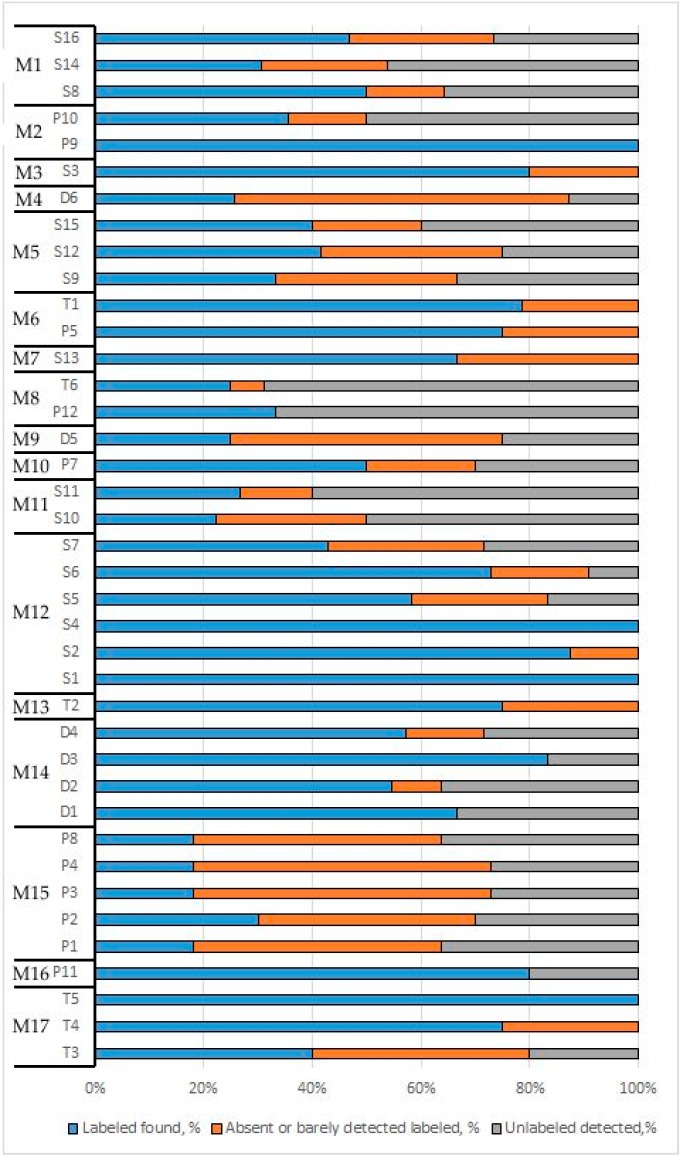
Figure 3.
Species composition analysis results from (meta)barcoding. Total number of labelled and found extraneous plants was taken as 100%. Blue: found plants that match the labelled; orange; labelled plants not found or found below the 1% threshold; grey: contaminants. Samples were grouped by manufacturer (M) from 1 to 17.

