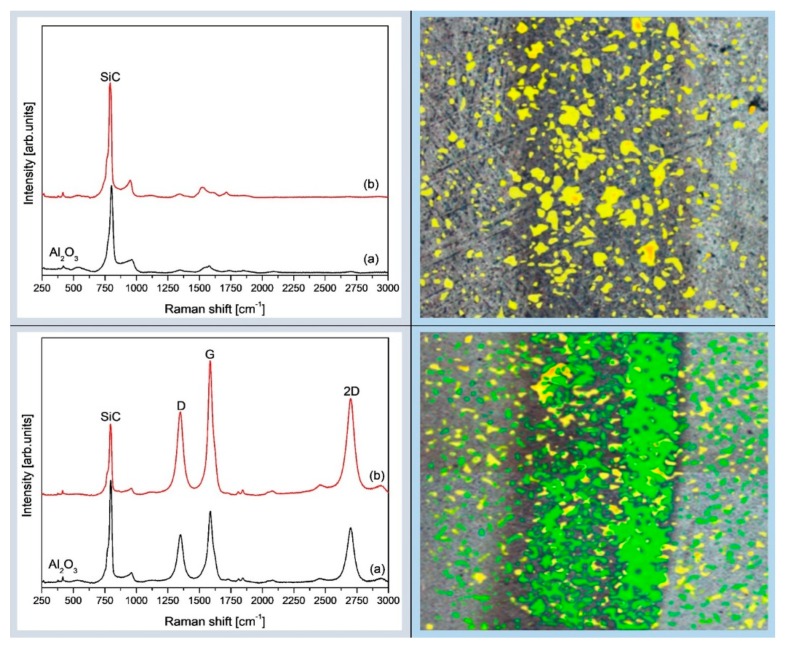
Figure 9.
(left column) The comparison of the Raman scans of Al2O3-SiCw (top) and Al2O3-SiCw/Graphene (bottom) composites obtained from surfaces without (a) and with wear (b). (right column) Raman maps of the debris created by merging the intensity maps of the SiC band and graphene-based structures band for the original polished and wear track surfaces and SEM photos of the analyzed area of the Al2O3-SiCw (top) and Al2O3-SiCw/Graphene (bottom) composites. Green and yellow color features are related to D- and G-peaks, and SiC peaks, respectively.

