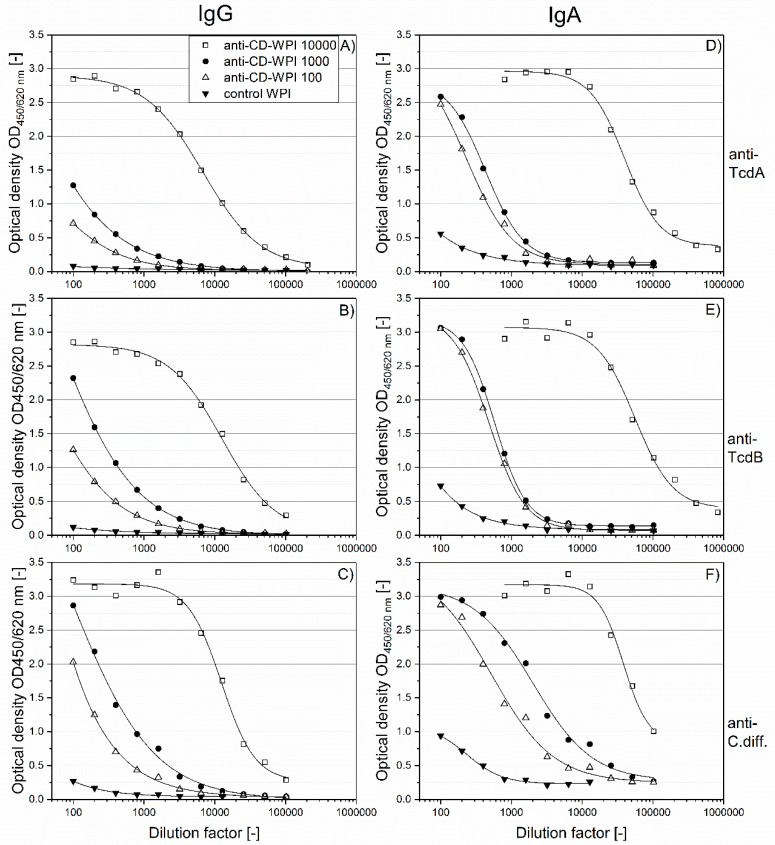
Figure 2.
Titration of IgG and IgA antibodies against the respective vaccine antigens. Serial dilutions of WPI 10,000 (open square), WPI 1000 (filled circle), WPI 100 (open triangle) and control-WPI (filled triangle) are plotted against their antibody content. IgG specific for TcdA, TcdB and Cdiff630 (A–C). IgA specific for TcdA, TcdB and Cdiff630 (D–F). Curves were adapted using the 4-parameter logistic model.

