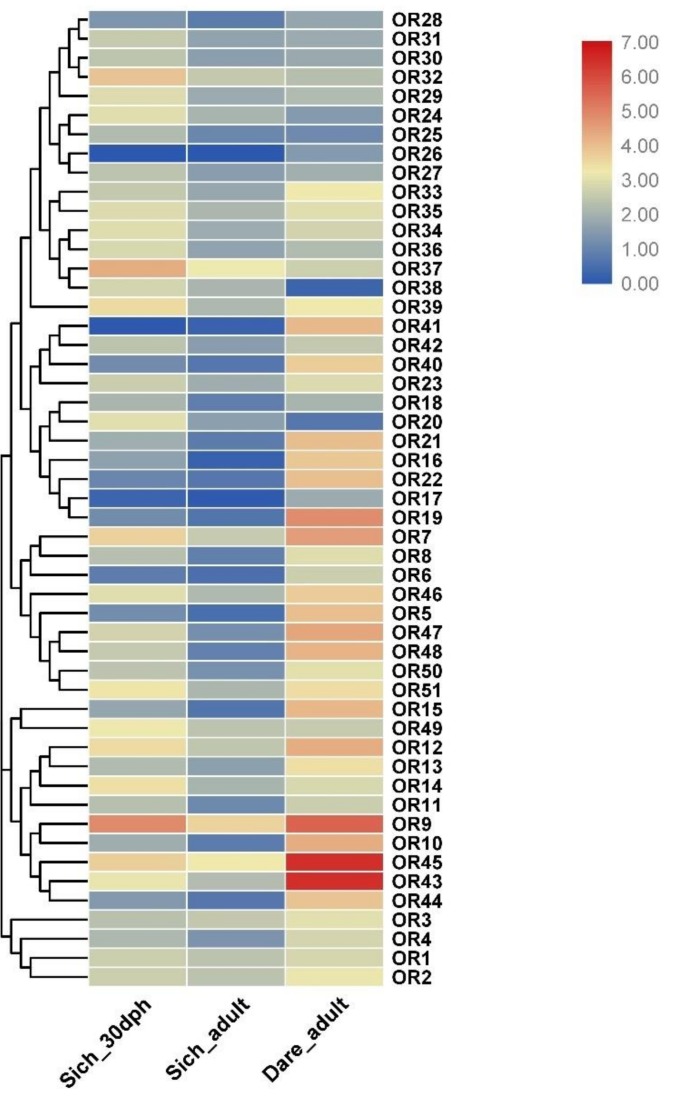
Figure 5.
Expression profiles of OR genes in the olfactory epithelium. Heat map showing the expression levels of OR genes in two stages of 30 dph and adult Chinese perch, and the adult zebrafish. As shown in the bar to the right of Figure 5, gene transcript abundance is represented by different colors in the map. The FPKM (fragments per kilobase of exon model per million mapped fragments) values of the OR genes are presented in Supplementary data 8.

