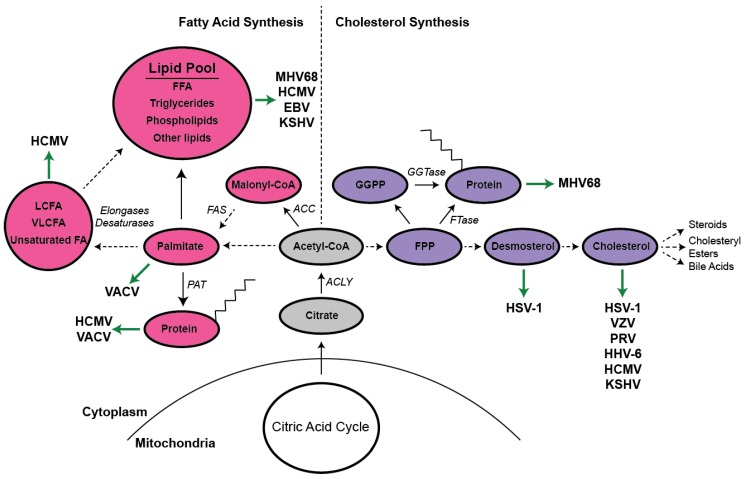
Figure 1.
Summary of the interplay between DNA virus infection and cellular lipid metabolism. This model illustrates a number of enzymes and intermediates involved in the synthesis of cholesterol (purple, right side), fatty acids (pink, left side), and related compounds. The precursor acetyl-CoA feeds both the mevalonate and fatty acid synthesis pathways. Virus interactions with these compounds are indicated by green arrows. Solid black arrows indicate the direct conversion of one molecule to the next, whereas dashed arrows indicate additional steps that, for the sake of simplicity, are not depicted. To conserve space, prenyl and palmitoyl moieties are depicted with only eight carbons. MHV68 (murine herpesvirus 68), HCMV (human cytomegalovirus), EBV (Epstein–Barr virus), KSHV (Kaposi’s sarcoma herpesvirus), VACV (vaccinia virus), HSV1 (herpes simplex virus-1), ACC (acetyl-CoA carboxylase), FAS (fatty acid synthase), PAT (palmitoyl acyl transferase), ACLY (ATP citrate lyase), LCFA (long chain fatty acids), VLCFA (very long chain fatty acids), FA (fatty acids), FFA (free fatty acids), FPP (farnesyl pyrophosphate), GGPP (geranylgeranyl pyrophosphate), FTase (farnesyl transferase), GGTase (geranylgeranyl transferase).

