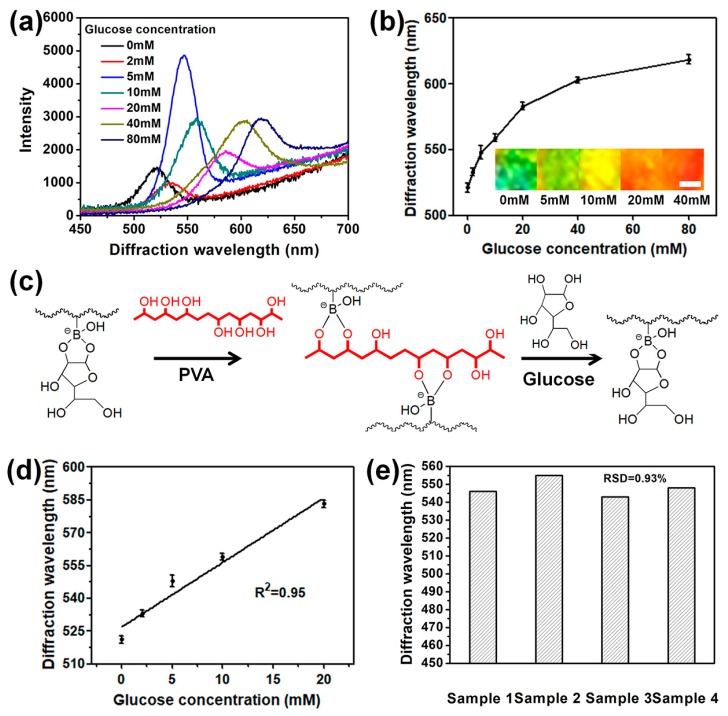
Figure 4.
(a) Representative diffraction spectra of 2D Au nanosphere arrays/PVA-PBA-modified hydrogel composite films in high ionic strength buffer solution at different glucose concentrations; (b) glucose concentration dependence of the diffraction wavelength of the composite films (Inset: photographs of 2D Au nanosphere arrays/PVA-PBA-modified hydrogel composite films at different glucose concentrations, the scale bar is 0.15 cm); (c) and interaction of PBA-modified hydrogel with the PVA and interaction of the PVA-PBA-modified hydrogel composite film with glucose in high ionic strength buffer solution. (d) Diffraction peak positions of the 2D Au nanosphere arrays/PVA-PBA-modified hydrogel composite films at the glucose concentration from 0 mM to 20 mM. The line is linear fit. Error bars represent standard deviation (SD) of four samples. (e) Diffraction wavelength of different samples at the glucose concentration of 5 mM.

