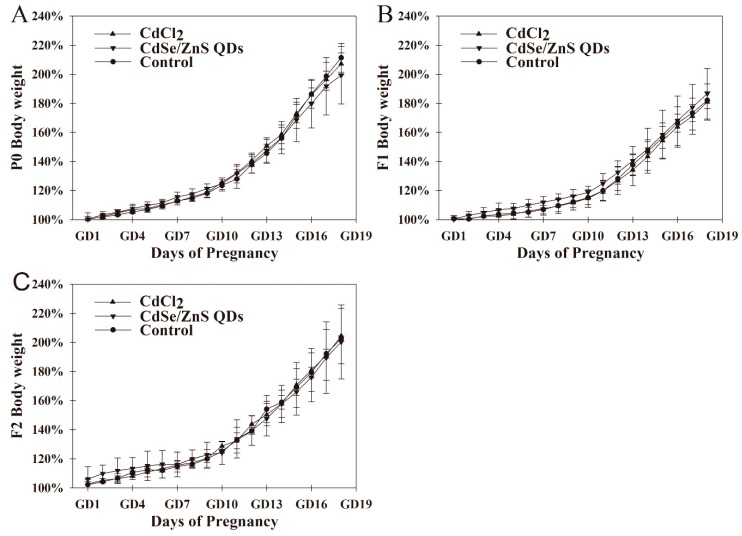
Figure 2.
Average body weights of three generational pregnant mice. (A–C) show changes in maternal body weight of P0, F1, F2, respectively; the body weight of pregnant mice were presented as a percentage of the weight while vaginal plug appeared (GD 0) (= 100%). These data are presented as the mean and SD, n = 6.

