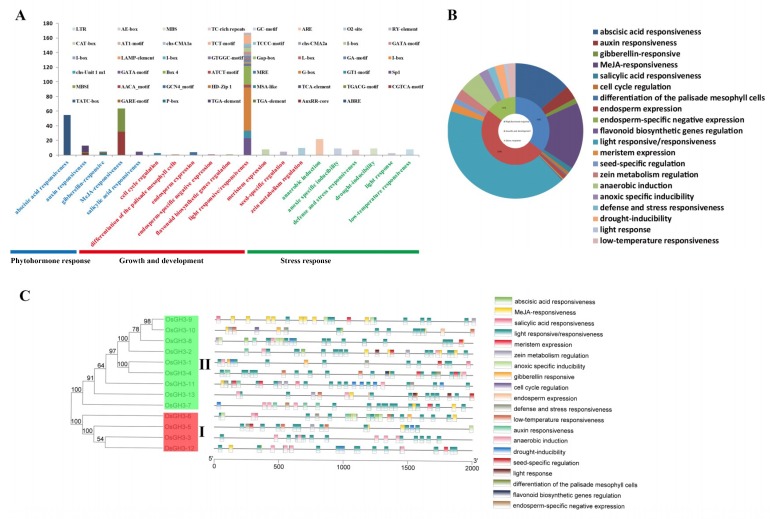
Figure 5.
Identification of cis-acting elements in all GH3 genes of Oryza sativa ssp. japonica. (A) The different bars represent different primary categories, the different characters represent different secondary categories, and the different colors in histograms represent the number of different promoter elements in each secondary category. (B) Pie charts of different sizes indicate the ratio of each primary/secondary category. (C) The different groups of GH3 genes in the phylogenetic tree are shown by different colors. The differently colored boxes represent the different secondary categories.

