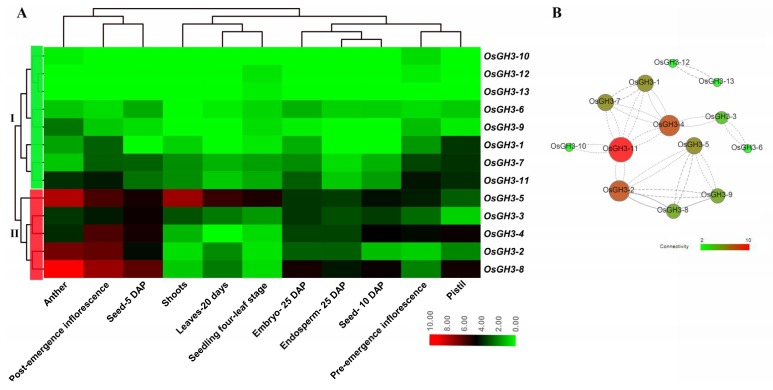
Figure 7.
Expression profiles of OsGH3 genes in different tissues (A) and a co-expression network diagram of OsGH3 genes in different tissues. (A) The color scale at the bottom of the image represents log2FPKM; red indicates a high level; and green represents a low level of transcript abundance. (B) The Correlation from weak to strong is shown by dotted line to solid line. Connectivity from weak to strong is shown from green to red. DAP, days after pollination.

