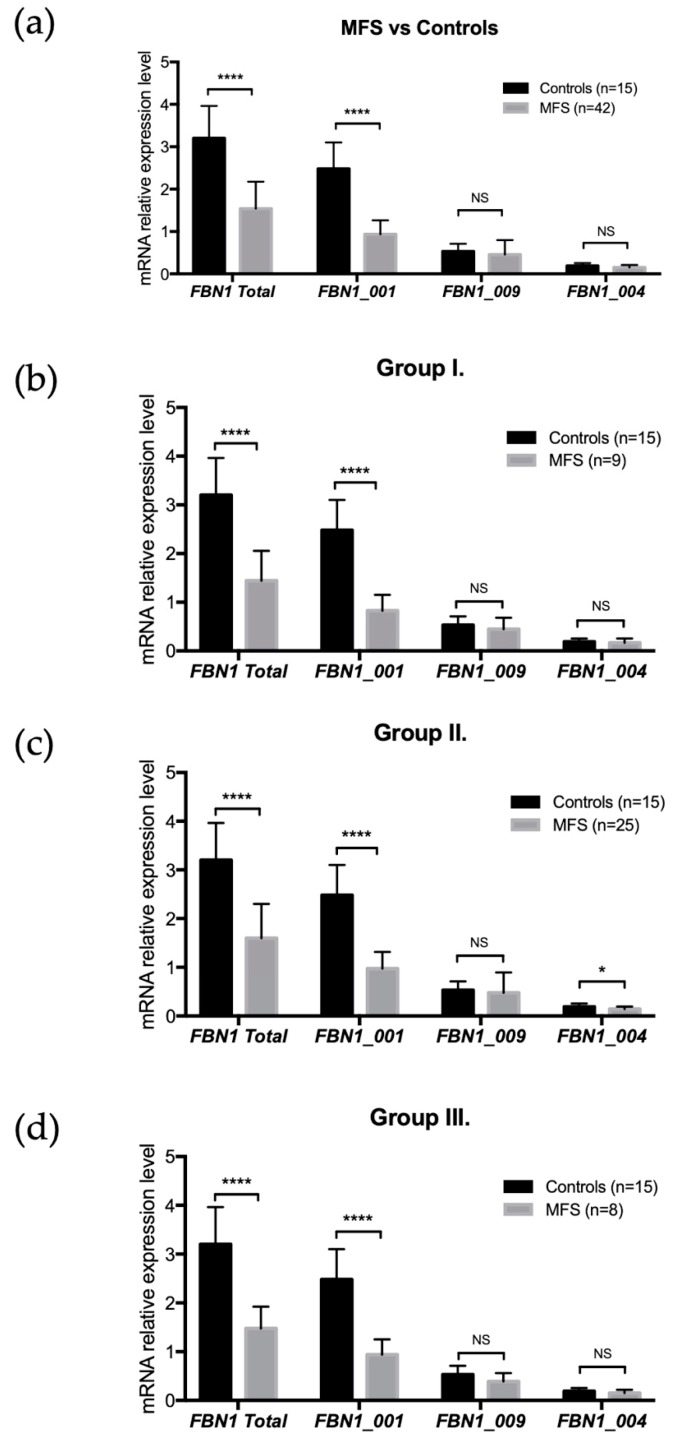
Figure 2.
FBN1 isoform expressions and FBN1 mutation locations. (a) FBN1 isoform expression levels in controls and MFS patients. A significant decrease in expression was found for MFS patients regarding FBN1 total expression (p < 0.0001) and FBN1_001 expression (p < 0.0001). No significant difference was found for the other two isoforms (FBN1_004 and FBN1_009). (b) Isoform expression levels in group I. A significant decrease in expression was found for FBN1 total expression (p < 0.0001) and FBN1_001 expression (p < 0.0001). No difference was observed for FBN1_004 and FBN1_009. (c) Isoform expression levels in group II. A significant decrease in expression was found for FBN1 total expression (p < 0.0001), FBN1_001 expression (p < 0.0001), and FBN1_004 expression (p = 0.015). No difference was observed for FBN1_009. (d) Isoform expression levels in group III. A significant decrease in expression was found for FBN1 total expression (p < 0.0001) and FBN1_001 expression (p < 0.0001). No difference was observed for FBN1_004 and FBN1_009. NS: p > 0.05; *: p < 0.05; ****: p < 0.0001.

