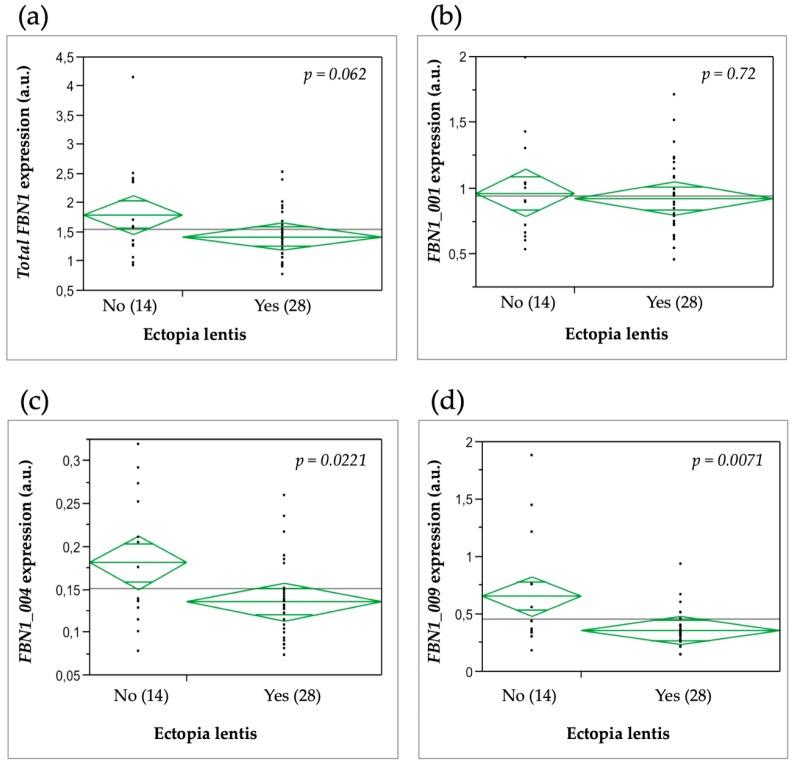
Figure 4.
FBN1 mRNA expression levels in MFS patients with or without ectopia lentis. (a) Total FBN1 expression; (b) FBN1_001 expression; (c) FBN1_004 expression; (d) FBN1_009 expression. Diamond plots display the means of each group. The line across each diamond represents the group mean, and the vertical span of each diamond represents the 95% confidence interval for each group.

