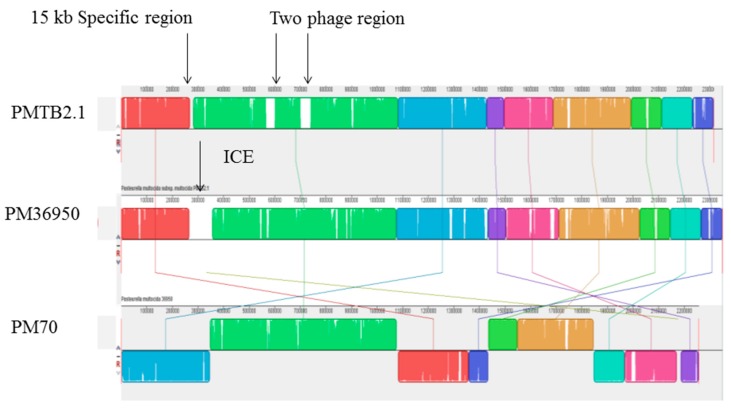
Figure 7.
Synteny analysis (co-linearity comparison) between PMTB2.1, PM70 and PM36950. Blocks with similar color represent similar sequences, while block with similar colors but with different orientation as in PM70 exhibit structural variation. PMTB2.1 specific two phage region and ICE region of PM36950 is represented by white color or gaps between nucleotide blocks indicated with arrows.

