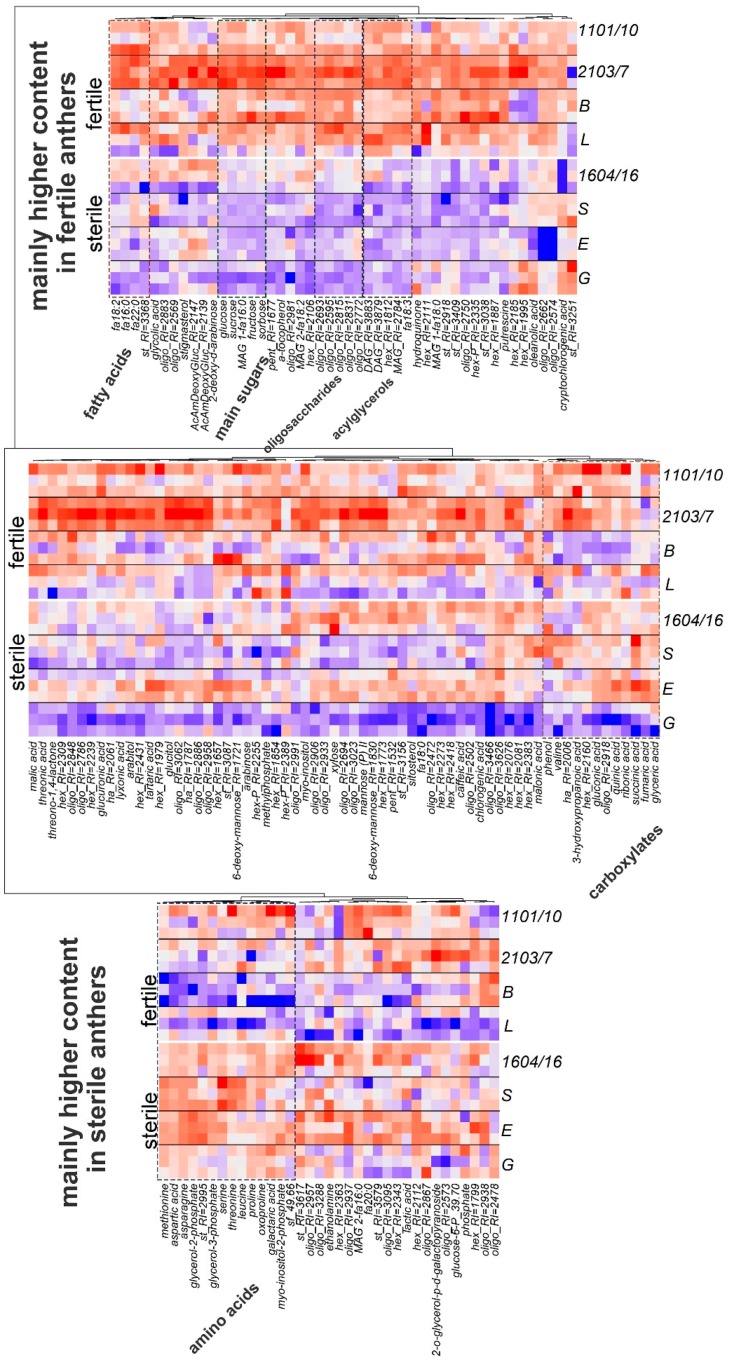
Figure 3.
Heat map visualization of the content of identified metabolites in anthers at the mature pollen stage from fertile and sterile potato genotypes. This was combined with HCA (hierarchical cluster analysis) using correlation as distance (1-r) and the Ward method for cluster agglomeration. Data was standardized with red–higher content, blue–lower.

