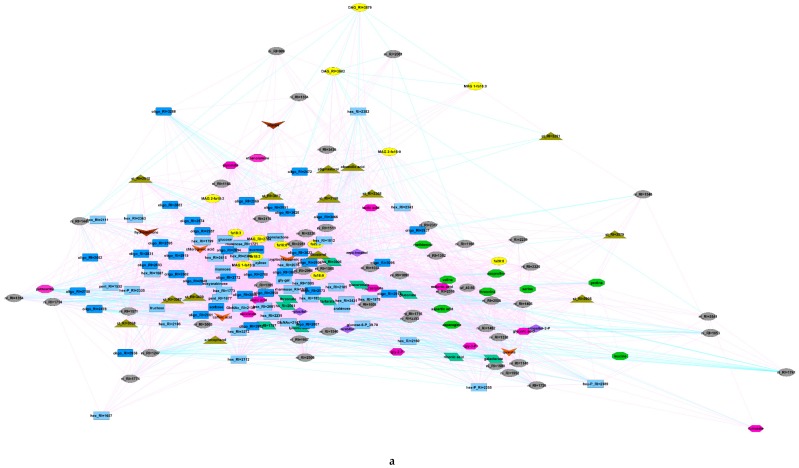
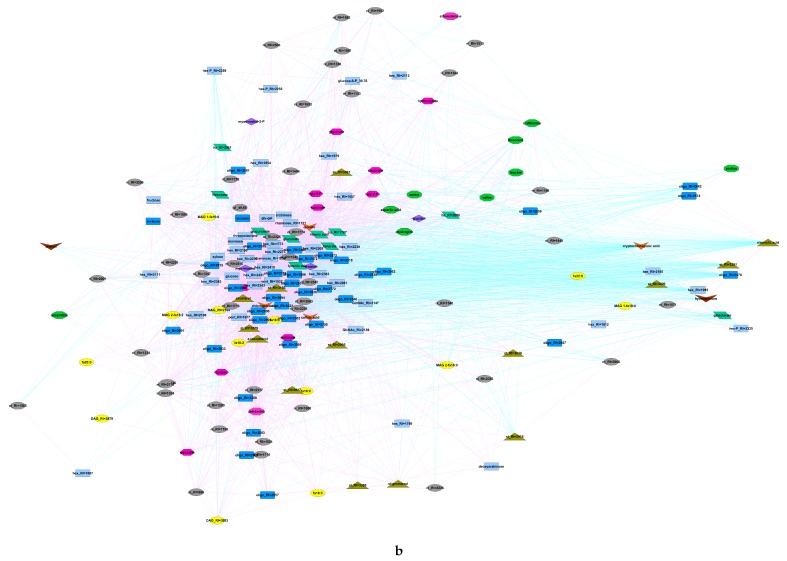
Figure 4.
Metabolomic networks of anthers at the mature pollen stage of male-fertile (a) and male-sterile (b) genotypes. Yellow ovals–fatty acids and derivatives, blue rectangles–carbohydrates (bright–mono-, dark–oligosaccharides), green parallelograms–sugar acids, green octagons–amino acids, red hexagons–different small molecules, mainly carboxylates and other, olive triangles–sterols, brown concave quads–phenolic compounds, red concave quads–secondary metabolites, grey ovals–unidentified compounds.


