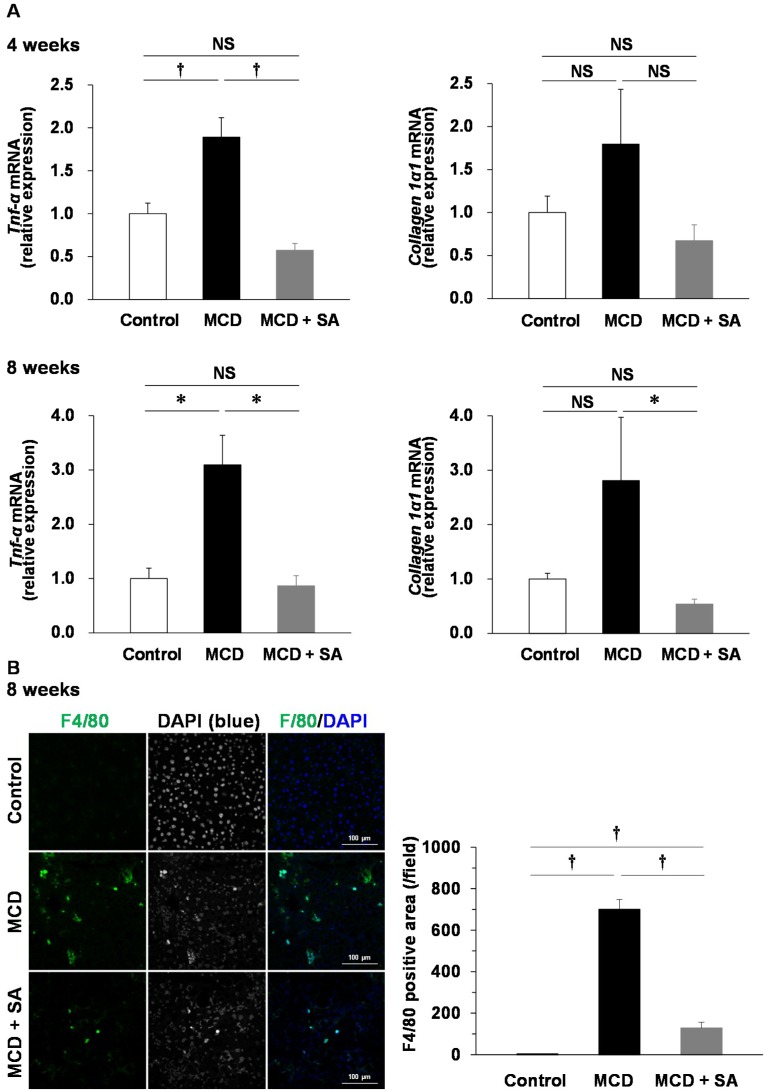
Figure 3.
Effects of SA on expression of Tnf-α and collagen 1α1 mRNA and macrophage infiltration in the liver of mice with MCD diet-induced steatohepatitis. (A) Expression of Tnf-α and collagen 1α1 mRNA was determined using real-time PCR. Data are the mean ± SEM for 4–5 mice per group. * p < 0.05, † p < 0.01, NS: not significant. (B) Liver sections were stained with F4/80 (green) and DAPI (blue). Representative immunofluorescence images are shown. The F4/80-positive area per field was analyzed using ImageJ. Data are the mean ± SEM for 3 mice per group. † p < 0.01.

