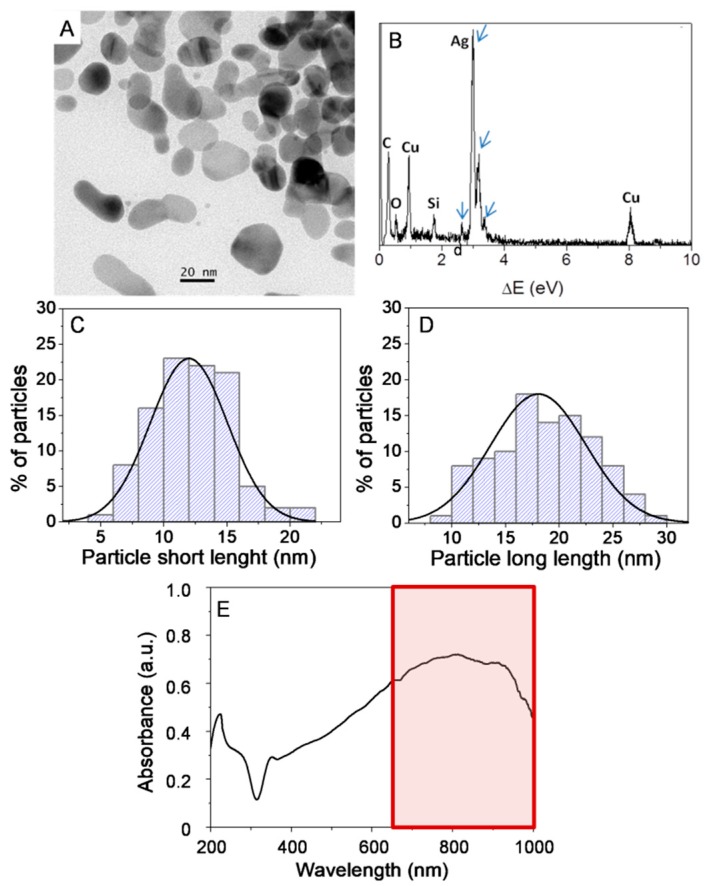
Figure 1.
Microstructural characterization of AgNPs by TEM (A), EDX analysis of AgNPs (B), in which arrows indicate silver peaks. Particles short-length (C) and long-length (D) histograms-based on the measurements of over 150 nanoparticles. UV-Vis spectrum of AgNPs in solution (E) showing a maximum absorption in the NIR region (650–1350 nm in a red box). Signals from the elements Si, Cu and C are originated from carbon-coated copper TEM grid.

