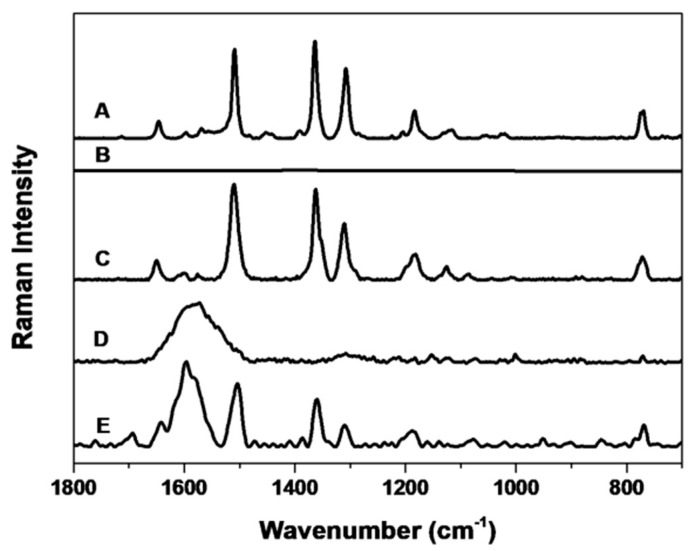
Figure 4.
Raman and SERS spectra from different steps in the nanosystem synthesis. Raman spectra of pure R6G solution (A) and R6G at the same concentration used in the AgNP@R6G@BSA nanosystem (B). No spectrum is obtained from (B) because of the very low concentration of R6G. SERS spectra of AgNP@R6G (C), which is Raman active but has a very limited colloidal stability. AgNP@BSA is not Raman active (D). Raman spectra of AgNP@R6G@BSA nanosystem (E).

