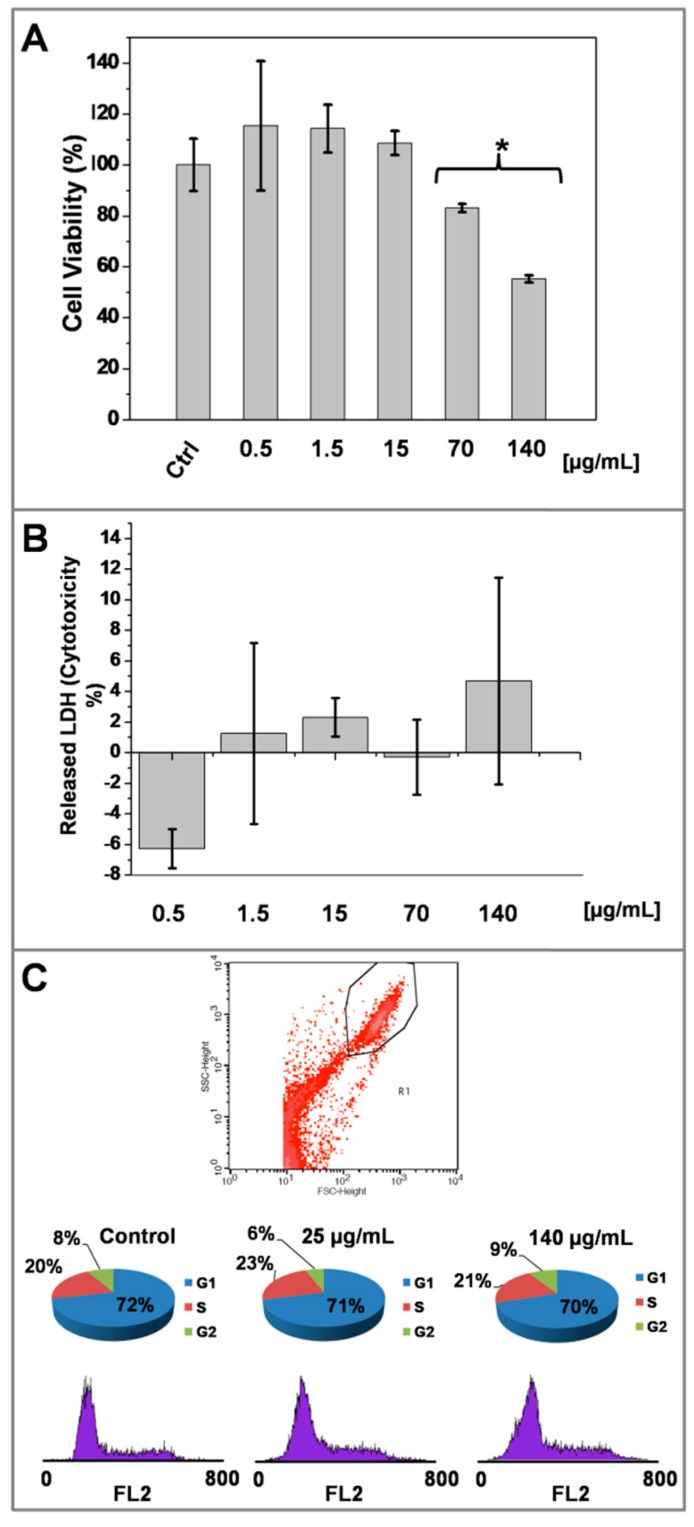
Figure 6.
Effect of AgNP@R6G@BSA on A431 human epidermoid carcinoma cell line biocompatibility. Mitochondrial function (MTT reduction) after 24 h of treatment with increasing concentrations of AgNPs (A). Lactate dehydrogenase release assay (LDH) after 24 h of treatment with increasing concentrations of AgNP@R6G@BSA (B). Flow cytometry analysis of cell cycle after 24 h of treatment with increasing concentrations of AgNP@R6G@BSA (C). Data represented the mean ± SD. Measurements were made in three replicas for each experimental condition.

