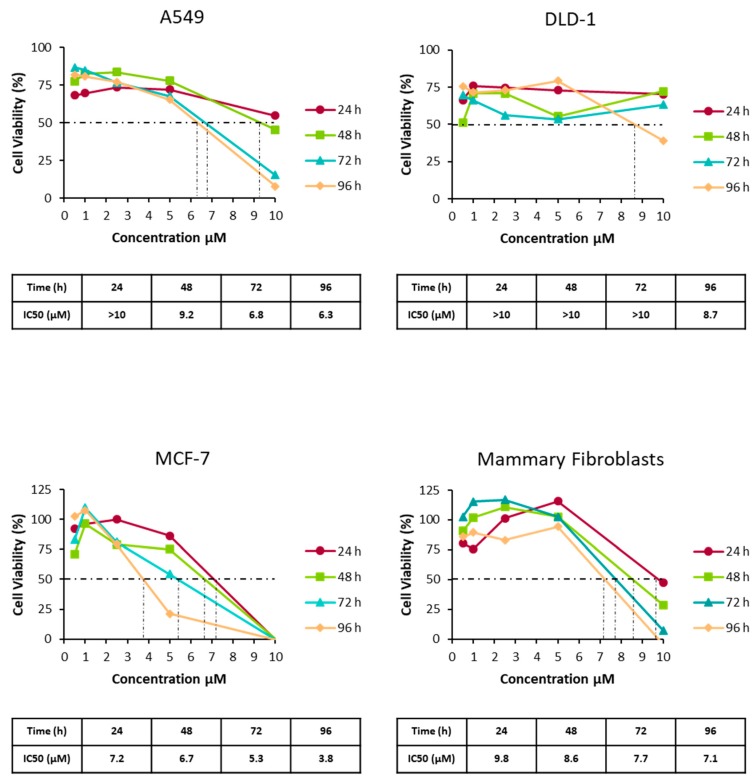
Figure 3.
Cell proliferation of A549, DLD-1, MCF-7 cancer cells lines and healthy mammary fibroblasts in the presence or absence of different concentrations of desertomycin G. Cell proliferation rates were determined on five consecutive days using an automated microtitre plate reader. *** Significant differences with a p value less than 0.005.

