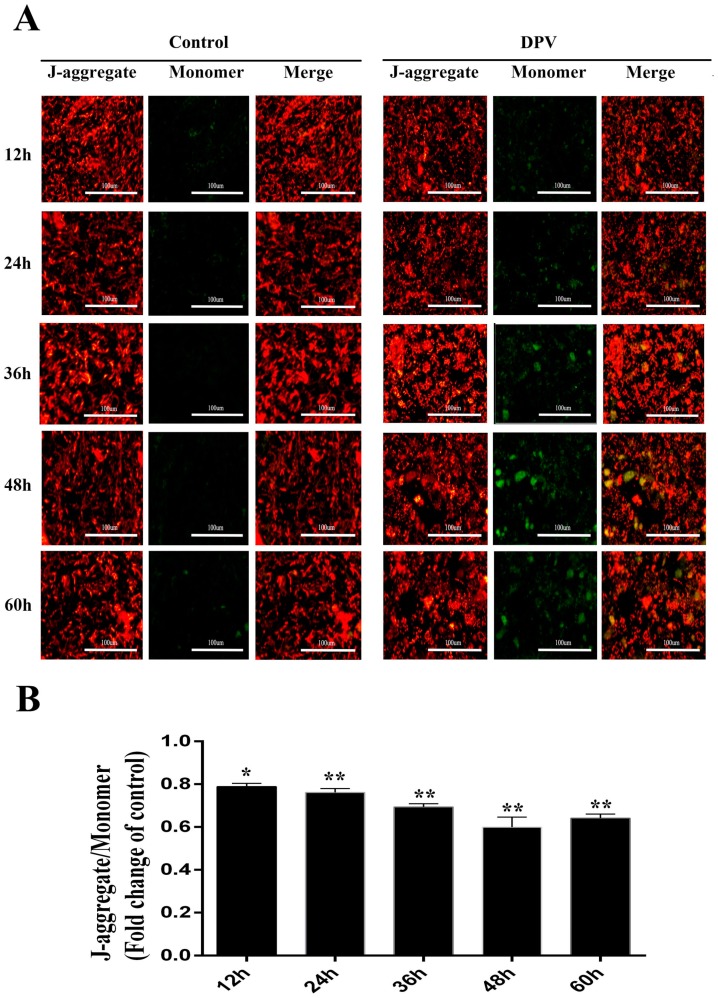
Figure 5.
Mitochondrial membrane potential (MMP) determination in DEFs. (A) Assessment of DEF MMP through JC-1 staining and fluorescence microscopy. Mitochondria with normal membrane potential are indicated in red, and mitochondria with reduced membrane potential are indicated in green. (B) Assessment of DEF MMP though JC-1 staining and a multifunctional microplate reader. The data are presented as the means ± SD of three independent experiments. * p < 0.05 and ** p < 0.01, compared with the control group.

