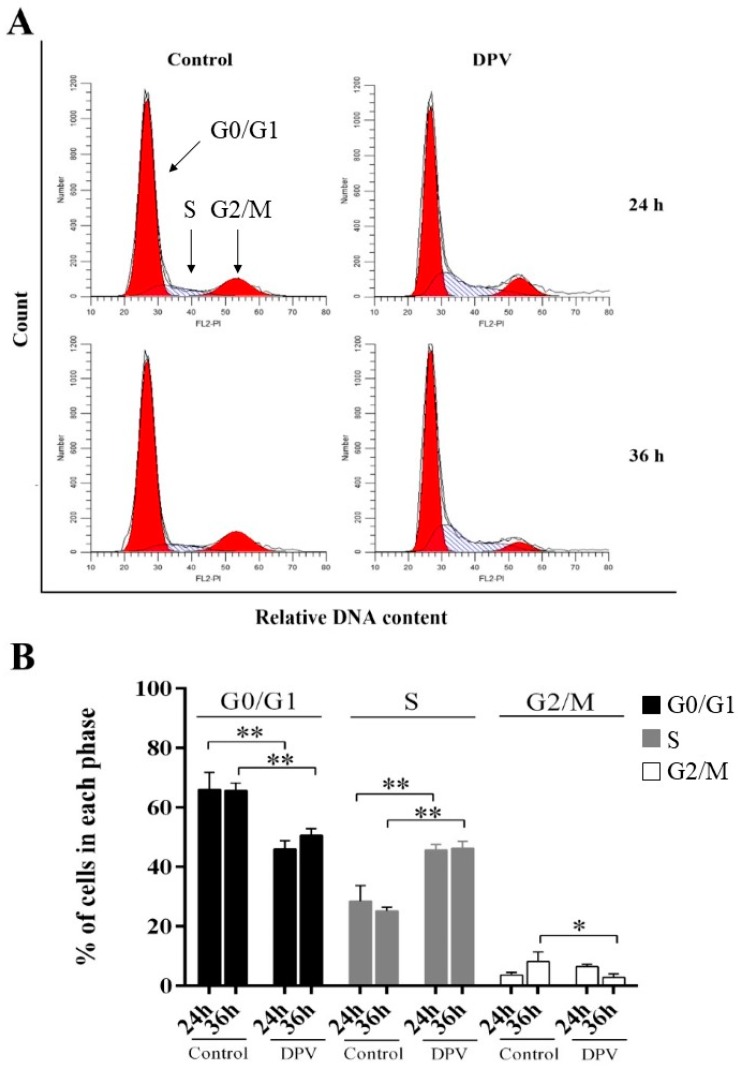
Figure 7.
DPV induces cell cycle arrest at the S-phase. (A) DEFs were mock-infected (control) or infected with DPV. Cells were collected postinfection (p.i.) at the times indicated for FACS analysis of the cell cycle. (B) Histogram of the percentage of DEFs in the G0/G1-, S-, and G2/M-phases of the cell cycle, with the percentage of cells in each phase of the cell cycle shown. The data are presented as the means ± SD of three independent experiments. * p < 0.05 and ** p < 0.01, compared with the control group.

