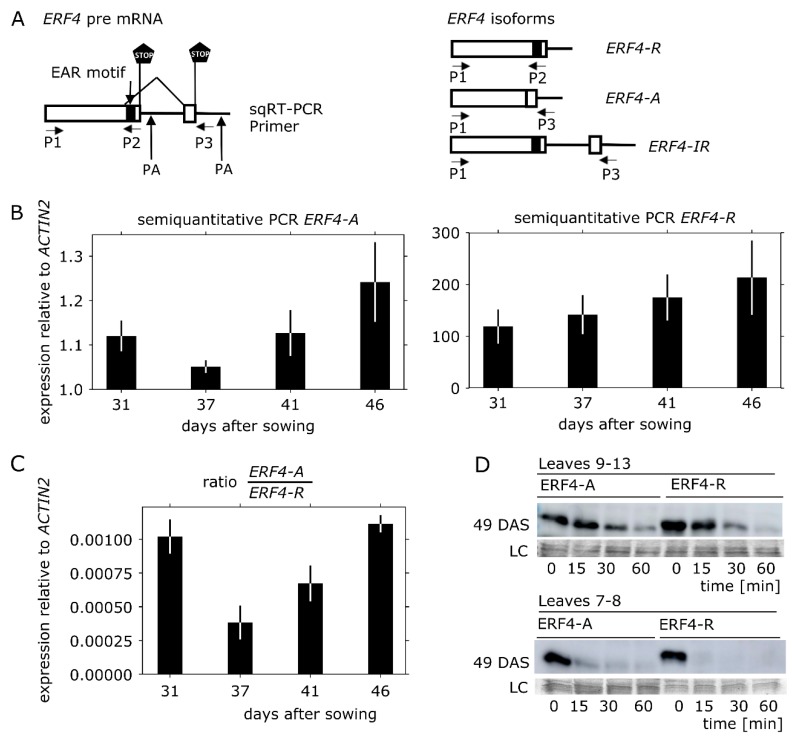
Figure 2.
ERF4 isoform expression and protein stability. (A) Schematic illustration of ERF4 pre-mRNA with two different polyadenylation sites and primer binding sites for primer 1 (P1), primer 2 (P2) and primer 3 (P3), which were used for semi-quantitative reverse transcriptase PCR (sqRT-PCR) as described in [27]. Boxes denote exons, lines denote introns and untranslated regions, PA indicates alternative polyadenylation sites, black box indicates the repressing ERF-associated amphiphilic repression (EAR) motif. cDNA of the ERF4 isoforms is shown on the right side. (B) Results of the sqRT-PCR using RNA isolated from Col-0 plants at different developmental stages indicated in days after sowing (DAS). Graph shows expression of ERF4-A (36 cycles, 3 μL cDNA) and ERF4-R (27 cycles, 2 μL cDNA), which was quantified using ImageJ and is presented relative to expression of ACTIN2. Error bars indicate ±SE, n = 3. (C) Ratio of ERF4-A to ERF4-R mRNA at different developmental stages (D) Cell-free protein degradation assay. 6xHIS-tagged ERF4-R (26.6 kDa) and ERF4-A (24.5 kDa) proteins were incubated in protein extract of young (No. 9−13) and middle old leaves (No. 7 and 8) for 0−60 min. Five plants were pooled for protein extraction and were harvested 49 days after sowing (DAS). Amido black staining of the upper part of the polyvinylidene difluoride (PVDF) membrane is shown as loading control (LC).

