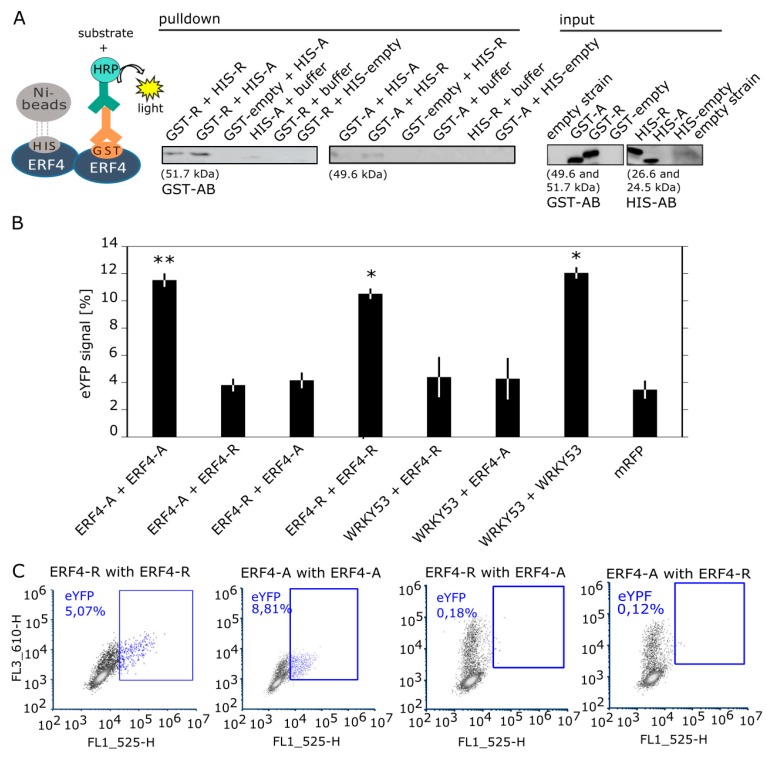
Figure 6.
Protein–protein interaction of ERF4-A and ERF4-R.(A) Pull-down assay was performed using total protein extracts from E. coli BL21 Rosetta cells. GST-tagged ERF4-R (51.7 kDa) and ERF4-A (49.6 kDa) was pulled down with HIS-tagged ERF4-R (26.6 kDa) and ERF4-A (24.5 kDa) proteins and immunodetected with anti-GST antibodies. The input protein (25 μg) was visualized with anti-GST and anti-HIS antibodies. The experiment shown was performed three times with similar results. (B) BiFC flow cytometry experiments were performed in Arabidopsis protoplasts co-expressing ERF4-R and ERF4-A fused with YFP-N and YFP-C, respectively. YFP-N fusion with WRKY53 and YFP-C fusions with both ERF4 isoforms were used as negative controls and YFP-N and YFP-C fusions with WRKY53 as positive control. RFP is expressed as transfection control. Bars represent percentage of cells with eYFP signal (mean values (±SE), n = 7 for combinations with ERF4 isoforms, n = 3 for combinations with WRKY53). Data was subjected to quantile normalization and determination of statistical differences was carried out using Wilcoxon rank sum test (* p ≤ 0.05, ** p ≤ 0.005). (C) Representative graphs of the flow cytometry results for ERF4 homodimers and heterodimers. Blue dots represent eYFP signals of interaction. Blue squares mark the cells showing eYFP signal.

