Figure 7.
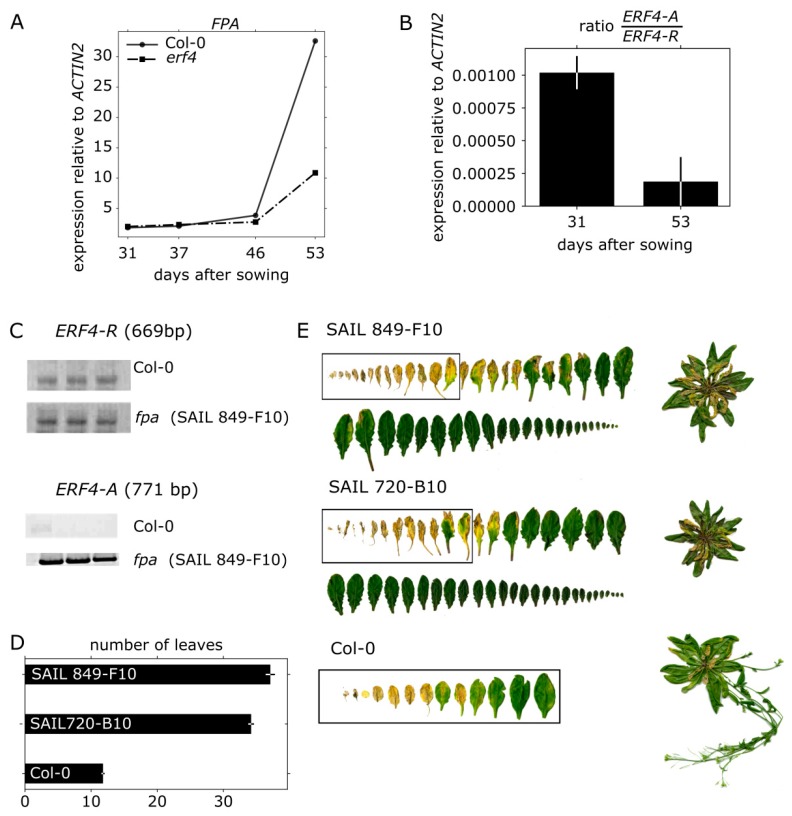
Characterization of fpa plants. (A) qRT-PCR data shows expression level of FPA in Col-0 and erf4 plants relative to ACTIN2. Leaves No. 7 of 5 biological replicates were pooled. Data are means of two technical replicates. (B) Ratio between ERF4-A and ERF4-R mRNAs at early (31 DAS) and late stages of development (51 DAS) (C) Semi-quantitative-PCR (sqRT-PCR) with RNA isolated from a pool of 10 plants was performed. Images show representative bands on a 1% agarose gel for ERF4-R (27 cycles, 2 μL cDNA, 669 bp) and ERF4-A (36 cycles, 3 μL cDNA, 771 bp) in Col-0 and fpa (SAIL 849-F10) plants of three technical replicates. (D) Number of rosette leaves 6 weeks (42 DAS) after sowing of fpa and Col-0 plants. Error bars indicate ±SE, n = 10. (E) Representative pictures of rosette leaves sorted according to their age 7.5 weeks (51 DAS) after sowing of two fpa lines (SAIL 849-F10 and SAIL 720-B10) and Col-0.

