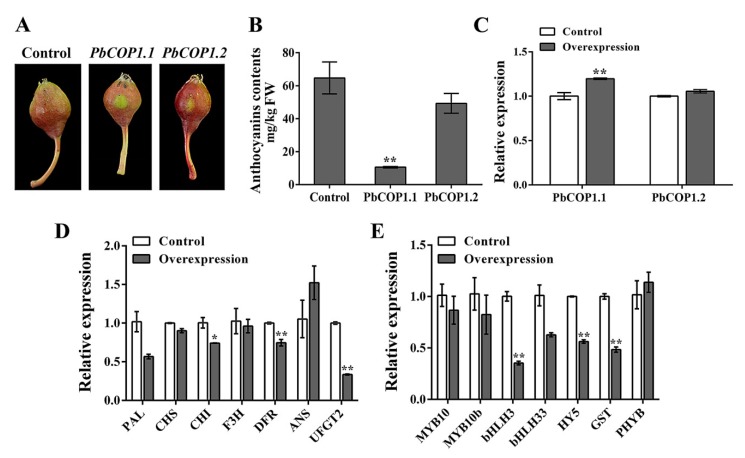
Figure 5.
The overexpression of PbCOP1.1 reduced fruit coloring in the ‘Red Bartlett’ peel. (A) The ‘Red Bartlett’ peel coloration around the injection sites after overexpressing PbCOP1s. Seven days after injection, the peels around the injection sites were used for qRT-PCR and anthocyanin contents analysis. (B) The anthocyanin contents in ‘Red Bartlett’ peels around the injection sites. (C) Expression levels of PbCOP1s in ‘Red Bartlett’ peels around the injection sites. (D) Expression levels of structural genes in PbCOP1.1 overexpressed fruit. (E) Expression levels of regulatory and anthocyanin-related synthetic genes in PbCOP1.1 overexpressed fruit. Error bars indicate the standard errors of the means. * indicates differences that are statistically significant at the P < 0.05 level; ** indicates differences that are statistically significant at the P < 0.01 level.

