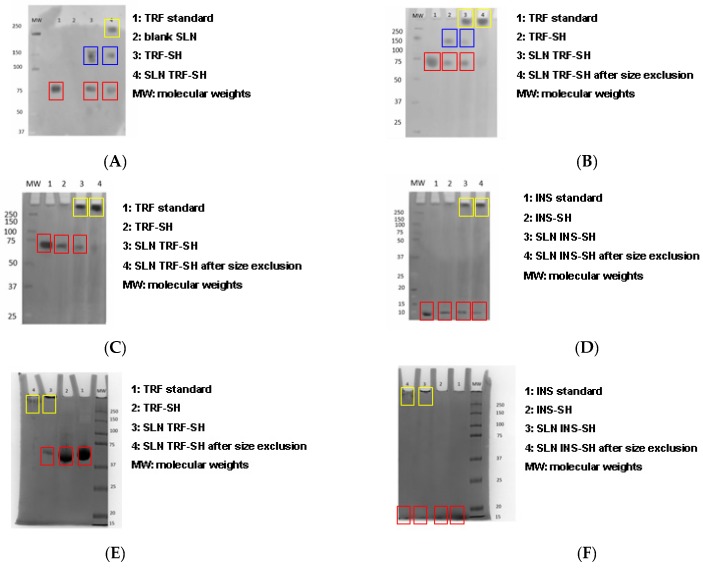
Figure 2.
Electrophoresis. Red boxes: free proteins; blue boxes: dimerized proteins; yellow boxes: proteins grafted onto SLNs. (A) ST-MBS; 8:1 2-iminothiolane/TRF molar ratio; (B) ST-MBS; 4:1 2-iminothiolane/TRF molar ratio; (C) ST-MBS; 2:1 2-iminothiolane/TRF molar ratio; (D) ST-MBS; 1:1 2-iminothiolane/INS molar ratio; (E) ST-PEG-MBS; 2:1 2-iminothiolane/TRF molar ratio; (F) ST-PEG-MBS; 1:1 2-iminothiolane/INS molar ratio.

