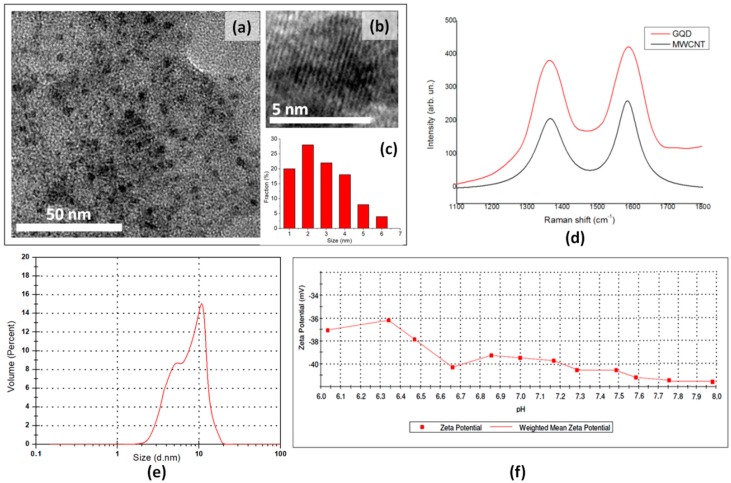
Figure 2.
(a) Representative TEM image of the as-prepared GQD; (b) high-resolution TEM image showing the crystal structure of an individual GQD;(c) size distribution of GQD derived from TEM images; (d) Raman spectra of GQD and MWCNT; (e) volume-weighted size distribution of GQD dispersions in deionized water; (f) isoelectric titration graph of the GQD sample in the pH range of 6–8 (evaluated as dependence of zeta potential on the pH of the medium for aqueous solutions of GQD).

