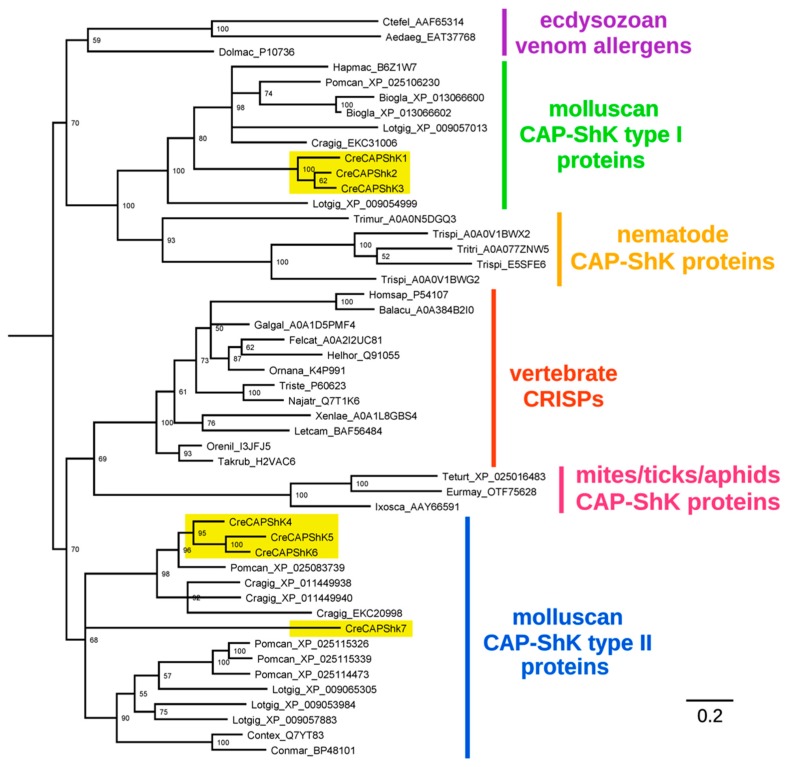
Figure 3.
Bayesian analysis of CAP-ShK proteins and other related invertebrate proteins. CreCAP-ShK sequences are highlighted with a yellow background. Posterior probability support values are shown for each node, and nodes with low support (<50%) have been collapsed. Sequences are named as follows: the first three letters of the genus and species name, followed by the sequence accession ID.

