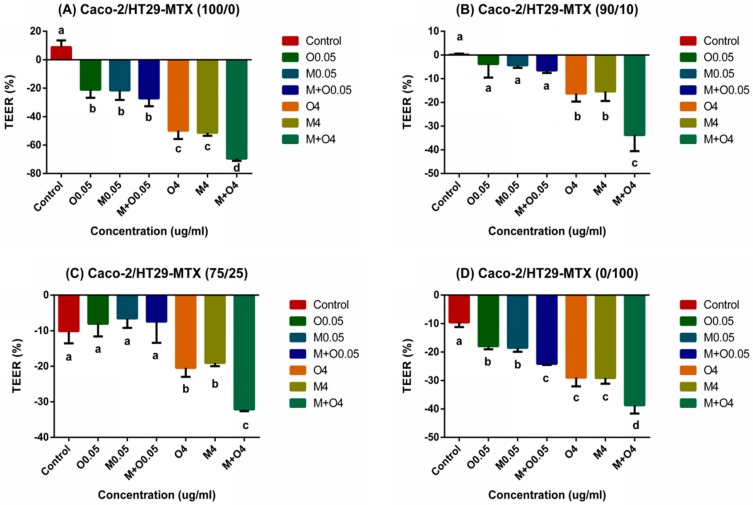
Figure 3.
Changes in transepithelial electrical resistance (TEER) values in differentiated Caco-2/HT29-MTX (A) 100/0, (B) 90/10, (C) 75/25, and (D) 0/100 co-cultures after treatment with different concentrations of AFM1 and OTA individually or collectively (AFM1+OTA) for 48 h. Results were expressed as the percentage of the difference to the initial value for each insert and are means ±SEM (n = 3), respectively. Different letters (a–d) indicate significant differences in TEER values (p < 0.05). M0.05 represents AFM1 at 0.05 μg/mL, M4 represents AFM1 at 4 μg/mL, O0.05 represents OTA at 0.05 μg/mL, O4 represents OTA at 4 μg/mL, M+O0.05 represents AFM1+OTA at 0.05 μg/mL, M+O4 represents AFM1+OTA at 4 μg/mL.

