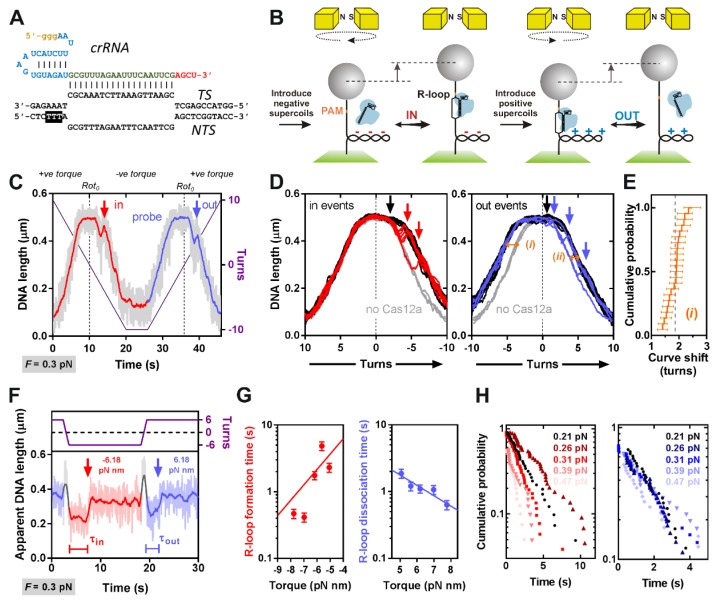
Figure 2.
Measurement of R-loop formation by LbCas12a using a magnetic tweezers assay. (A) DNA protospacer sequence (black) and CRISPR RNA (crRNA) showing the G-residues from in vitro transcription (brown), the pseudoknot (blue) and spacer (red). (B) Principle of the MT assay. See main text. (C) R-loop cycling experiment (1 turn s−1) in the presence of 5 nM Cas12a:crRNA. Raw DNA length taken at 60 Hz (grey). Data smoothed by a 1 Hz moving average (dark colors). DNA is negatively supercoiled at 0.3 pN (red) to induce R-loop formation (in), followed by positive supercoiling to probe R-loop formation (blue), resulting in R-loop dissociation (out). Rot0 are points where DNA turns are zero. (D) Overlay of R-loop cycles (N = 22) for negative supercoiling (in events) and positive supercoiling (out events). Cycles without Cas12a are in grey. Data was smoothed by a 1 Hz moving average. (i) and (ii) show rotation curve shifts due to captured R-loops. (E) Rotation curve shift due to R-loop events (i). Average = 1.87 ± 0.27 turns (errors = SD). (F) Examples of repetitive R-loop formation cycling (at 10 turns s−1) to measure R-loop formation times. Raw and 1 Hz smoothed data are shown. (G) Mean R-loop formation/dissociation times and standard error (N = 40 to 52) as a function of torque [29]. Solid lines are fits to Equation (1) (Table 1) [27]. (H) Inverted cumulative probability over time for R-loop formation (left) and dissociation (right) used to calculate mean times in panel F.

