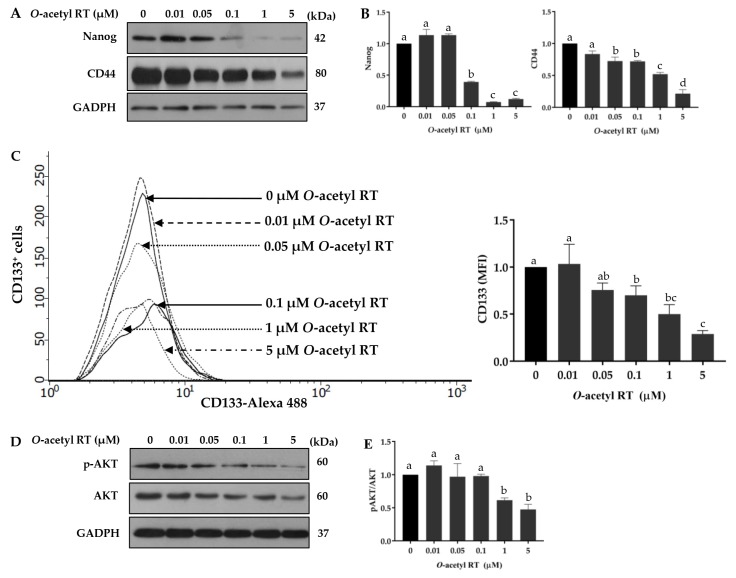
Figure 3.
O-acetyl RT inhibits cancer stem cell signals. Cells were treated with O-acetyl RT (0–5 µM) for 24 h. The expression levels of cancer stem cell markers CD44 and Nanog in H292 cells were determined by Western blot analysis. (A) The blots were reprobed with the GADPH antibody. (B) Relative protein levels were determined by densitometry. (C) The CD133+ cells were determined by flow cytometry. (D) Cellular levels of activated AKT (p-AKT) and total AKT were examined by Western blot analysis. (E) The immunoblot signals were quantified by densitometry. Data represent the mean ± SD (n = 3). Bars labeled with different letters (a, b, c, d) are significantly different at p < 0.05.

