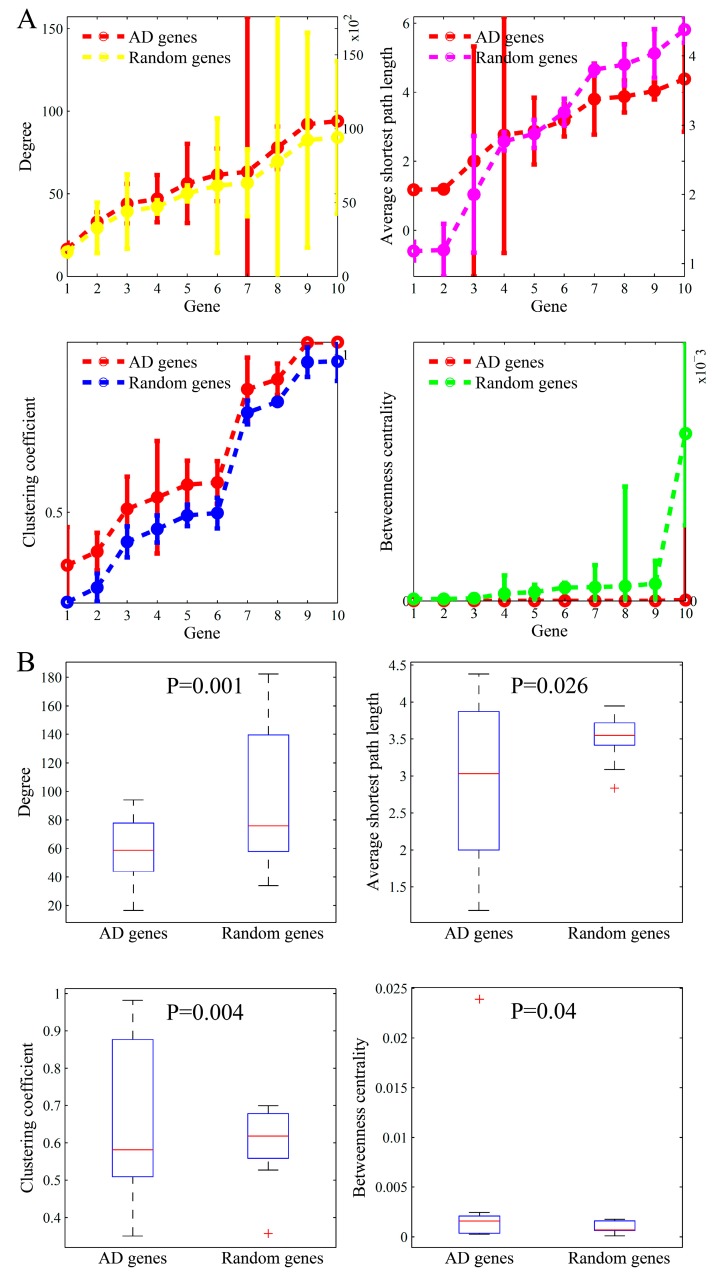
Figure 6.
The comparison of topological parameters between AD (Alzheimer’s disease) genes and randomly-selected genes. (A) The means (left y-axis) and standard deviations (right y-axis) of the four parameters in the ten AD gene groups and those corresponding in the randomly-selected ten gene groups. (B) Boxplots of these parameters.

