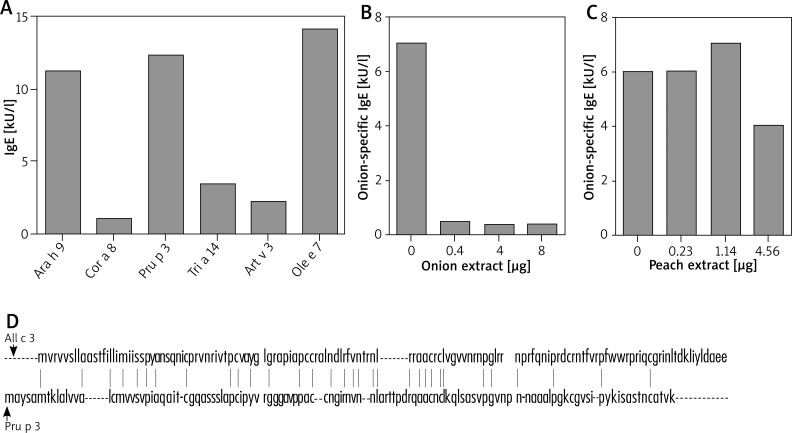
Figure 2.
Evaluation of onion cross-reactivity. A – Circulating LTP-specific IgE as measured by ImmunoCAP. B – IgE-ELISA inhibition by onion proteins. Serum of the patient was incubated for 24 h at 4°C with the indicated amount of onion protein from an in-house extract. C – IgE-ELISA inhibition by peach proteins. Serum of the patient was incubated for 24 h at 4°C with the indicated amount of peach protein from an in-house extract. D – All c 3 and Pru p 3 amino acid sequence identity. Vertical lines between the two sequences indicate the identical amino acid residues

