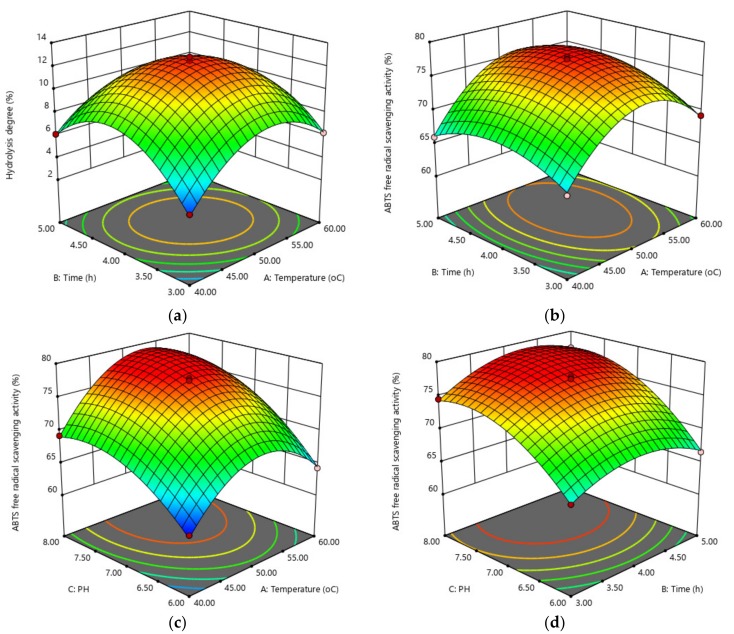
Figure 2.
Three-dimensional (3D) response surface plots. (a) Hydrolysis degree (%) as a function of temperature (°C) × time (h); (b) ABTS+• scavenging activity (%) as a function of temperature (°C) × time (h); (c) ABTS+• scavenging activity (%) as a function of temperature (°C) × pH; (d) ABTS+• scavenging activity (%) as a function of time (h) × pH.

