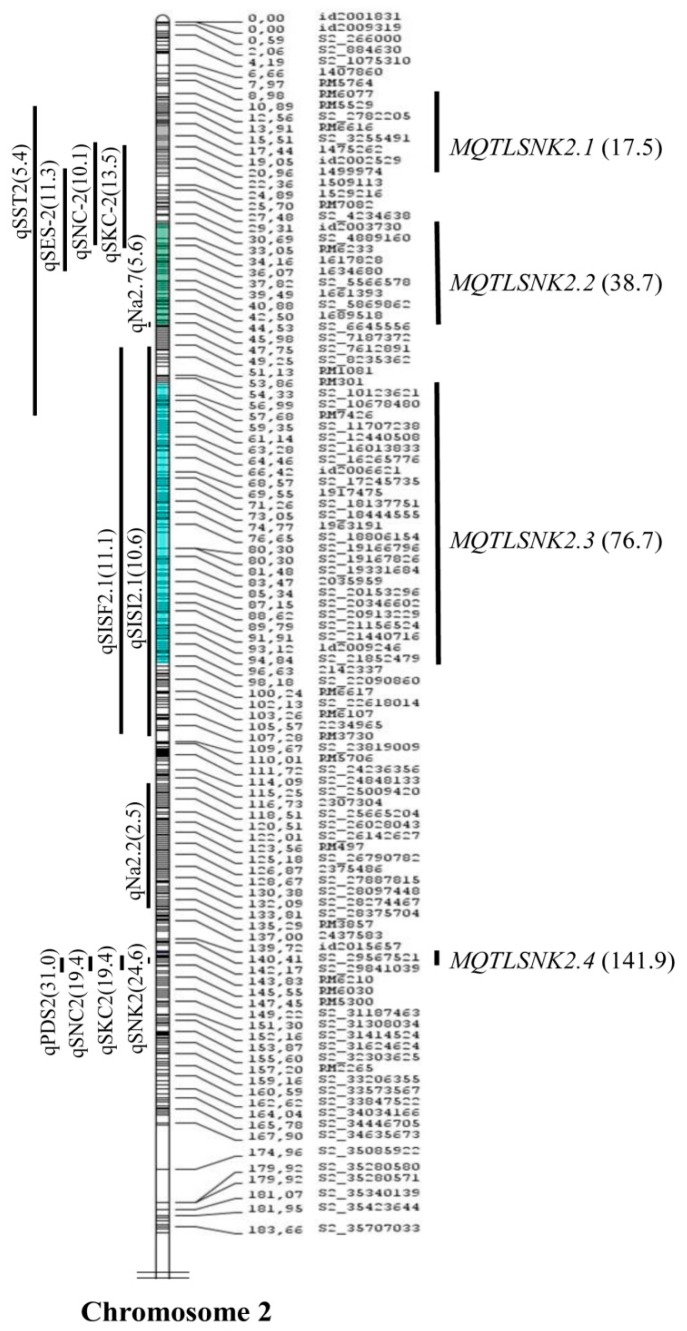
Figure 4.
Meta-QTLs for shoot sodium potassium ratio (SNK) in rice on chromosome 2. Vertical lines on the left of the chromosomes show the confidence interval of each QTL and values in parentheses indicate the percentage of phenotypic variation explained by these QTLs. Four meta-QTLs for SIS were shown on the right of the chromosomes, with the confidence interval indicated by vertical bars and the peak position of the meta-QTLs in cM on the consensus map (in parenthesis).

