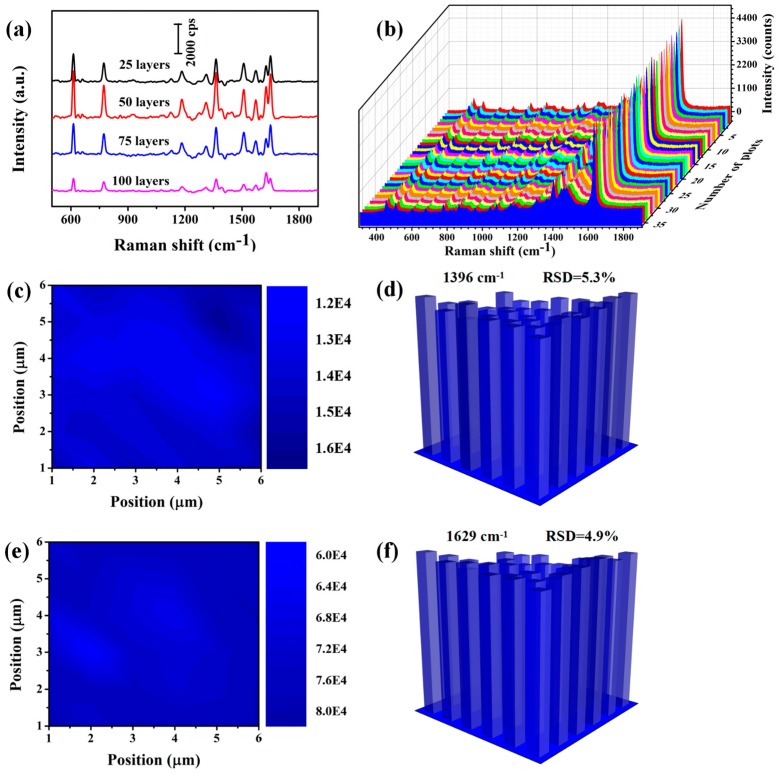
Figure 11.
(a) Raman spectra of R6G molecules with 10−3 M concentration from the different layers film substrates. (b) SERS spectra of MB obtained on 36 random locations from 6 different MXene-SO3H/MB-50 film substrates. (c,e) Raman mapping image at 1396 and 1629 cm−1 of MB molecules with cover the area of 6 × 6 μm2 of the MXene-SO3H/MB-50 film substrate. (d,f) The corresponding bar plot of Raman intensity at 1396 and 1629 cm−1 in the above detection area of MXene-SO3H/MB-50 film substrate.

