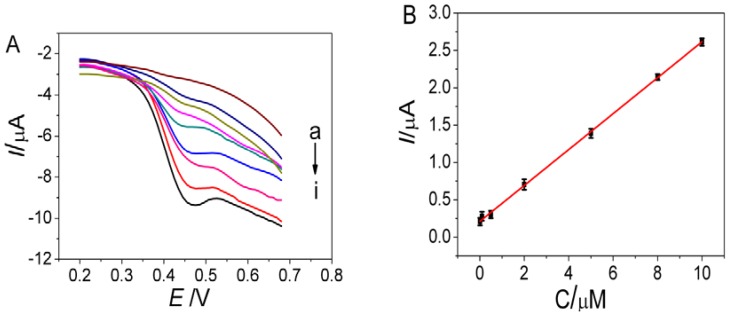
Figure 5.
(A) Differential pulse voltammetric (DPV) response of the aptasensor incubated with different concentrations of MG: (a): 0 (b): 0.01, (c): 0.05, (d): 0.1, (e): 0.5, (f): 1.0, (g): 5.0, (h): 8.0, and (i): 10 μM. (B) Calibration curve corresponding to the peak current as a function of MG concentration.

