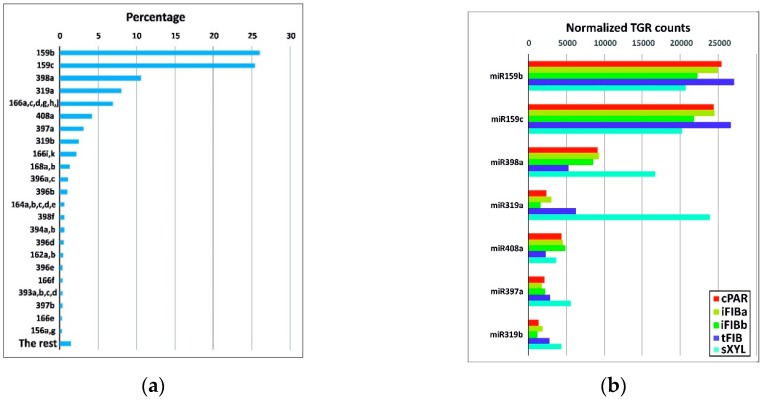
Figure 3.
(a) The most abundant known miRNA families. The indicated miRNA flax families are represented by more than 1000 normalized TGR counts, and “The rest” have fewer than 1000 normalized TGR counts across all the samples as a whole. (b) Normalized TGR counts of the 5 most abundant miRNA families across the samples.

