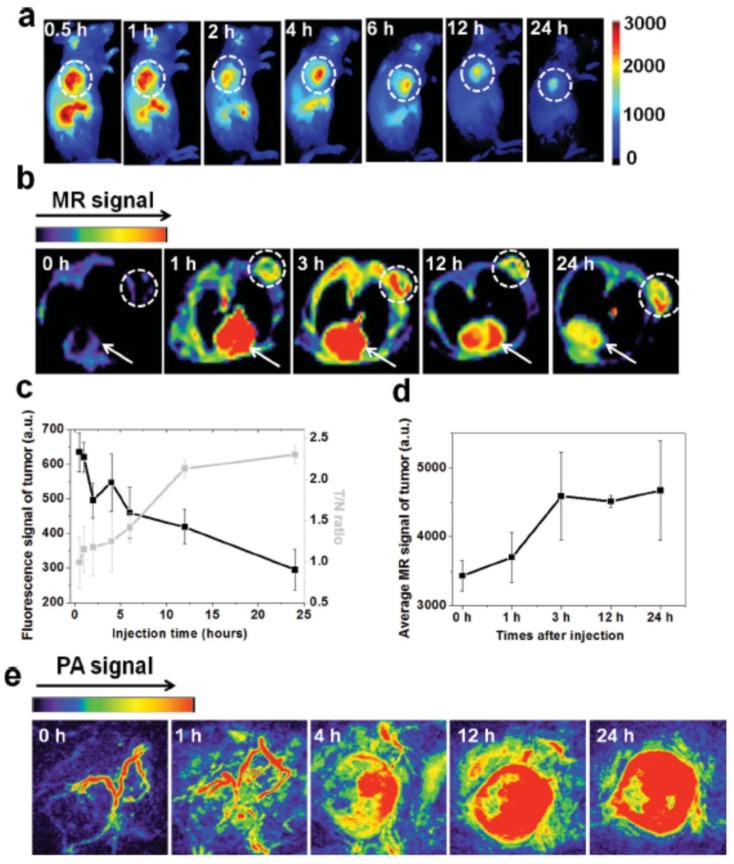
Figure 12.
(a) In vivo fluorescence imaging and (b) MRI of mice bearing 4T1 tumor cells taken at different time points post-injection with IR825@C18PMH-PEG-Ce6-Gd (200 μL, [Ce6] = 0.5 mg/mL, [IR825] = 1.3 mg/mL); dashed circles in (a) and (b) highlight the tumor, while arrows in (b) point to the heart; (c) quantification of tumor signals and tumor-to-normal tissue signal (T/N) ratios from fluorescence images shown in (a) at different post-injection times; (d) quantification of average T1-MRI signals in the tumor by manual drawn region of interest at different post-injection times; (e) in vivo PA imaging of mice bearing 4T1 tumor cells taken at different time points post-injection of IR825@C18PMH-PEG-Ce6-Gd. Reproduced from Reference [49] with permission from Advanced Functional Materials, 2014.

