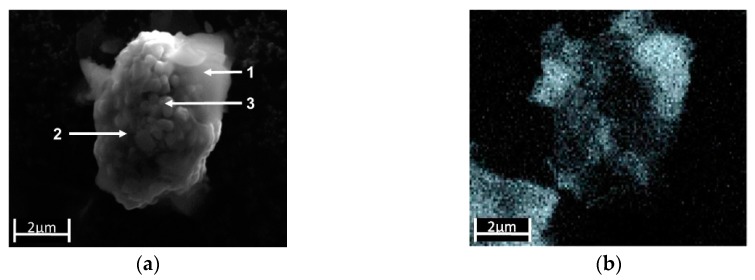
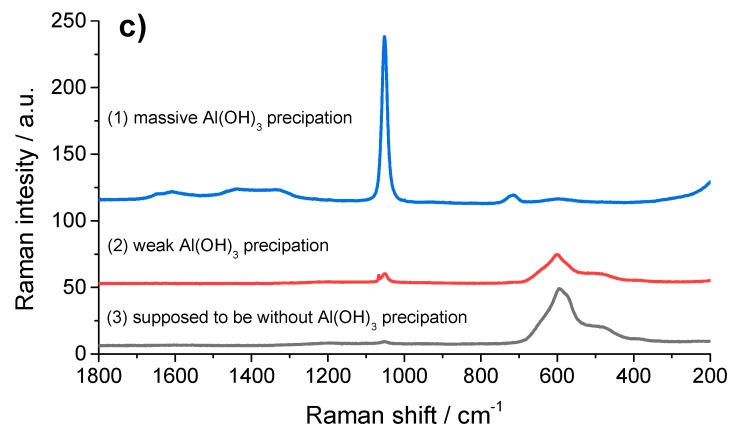
Figure 6.
(a) SEM image of a NMC particle partially covered with Al(OH)3. (b) The corresponding SEM/EDX mapping of the element distributions of Al (grey: High Al intensity). (c) Comparison of the Raman spectra from different regions of the particle: (1) Visible precipitation of Al(OH)3, (2) region with apparently low Al(OH)3 coverage, (3) region without SEM/EDX detectable Al(OH)3 coverage.


