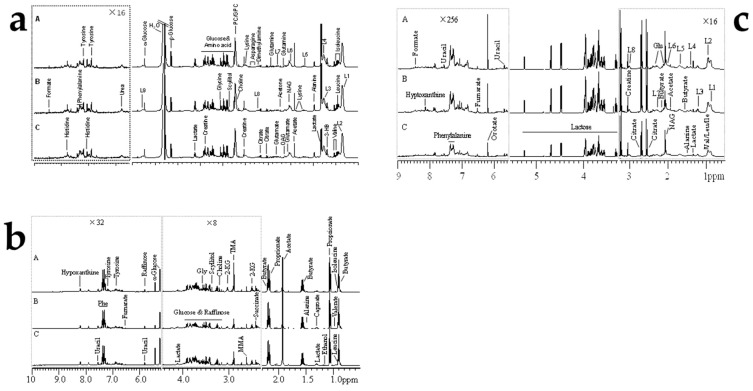
Figure 2.
Representative 600 MHz 1D NOESY 1H-NMR spectra (δ 0.5–5.5 and δ 5.5–9.0) of rumen fluids (a), plasma (b), and milk (c) samples obtained from (A) control group, (B) AFB20 group, and (C) AFB40 group. The δ 5.5–9.0 region is magnified 16 times relative to the corresponding δ 0.5–5.5 region for the purpose of clarity. Key: Glu: glutamate; NAG: N-acetyl glycoprotein signals; L1: LDL, CH3-(CH2)n-; L2: VLDL, CH3-(CH2)n-; L3: LDL, CH3-(CH2)n-; L4: VLDL, CH3-(CH2)n-; L5: VLDL, -CH2; L6: lipid, -CH2-CH=CH-; L7: lipid, -CH2-C=O; L8: lipid, =CH-CH2-CH=.

