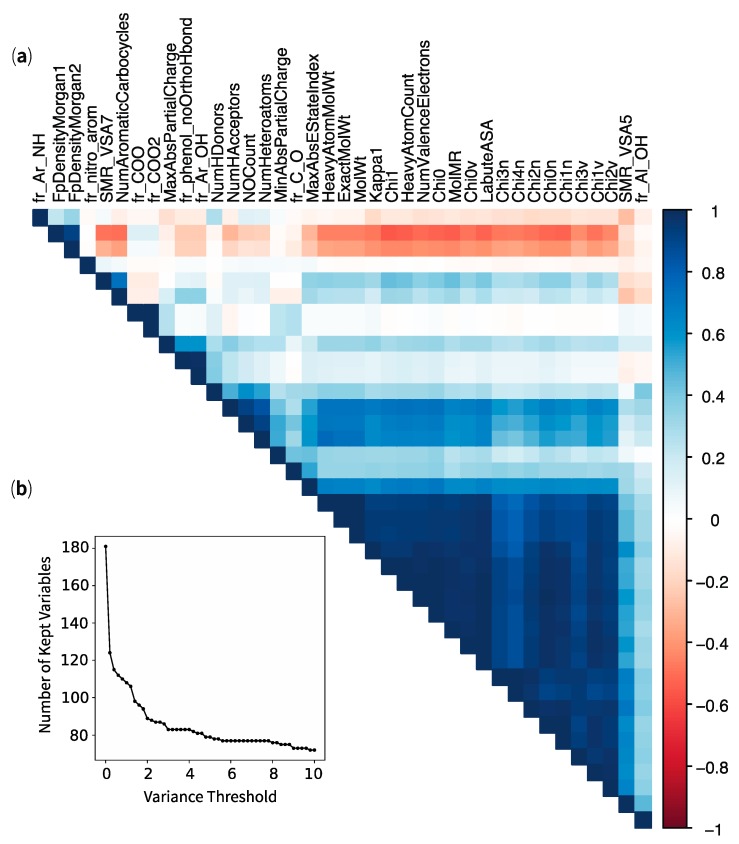
Figure 3.
Analysis of the 200 variables with (a) a correlogram showing high multicollinearity (Pearson correlation rank > 0.9) between 39 variables and (b) a scatterplot showing the reduction of kept variables with an increasing variance threshold—19 variables have no information (not shown) and roughly 60 variables have low or no variance (threshold value close to zero). For complete correlograms with Pearson and Spearman correlation ranks, see Supplementary Materials.

