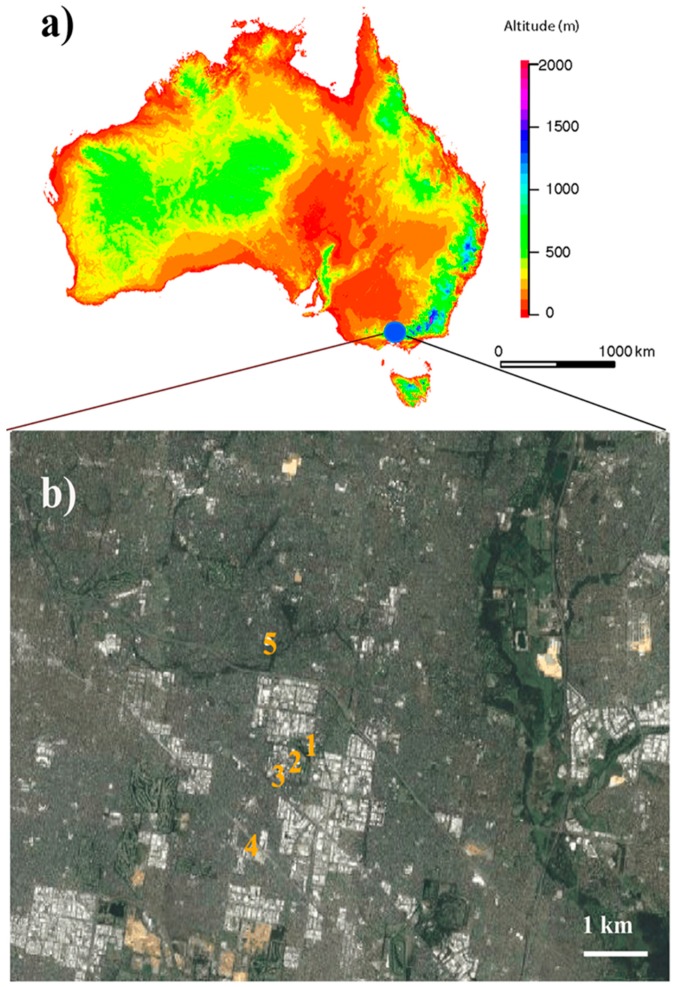
Figure 1.
A map of the study area: (a) Map of Australia showing the geographical location of the study sites (blue solid circle) and (b) the numbers on the map show the sampling locations at Monash University, Clayton Campus and its surroundings of Melbourne, Australia. The map was prepared in R version 3.5.1 using packages “maps”, “dismo”, and “raster” [48] (R core Team 2018).

