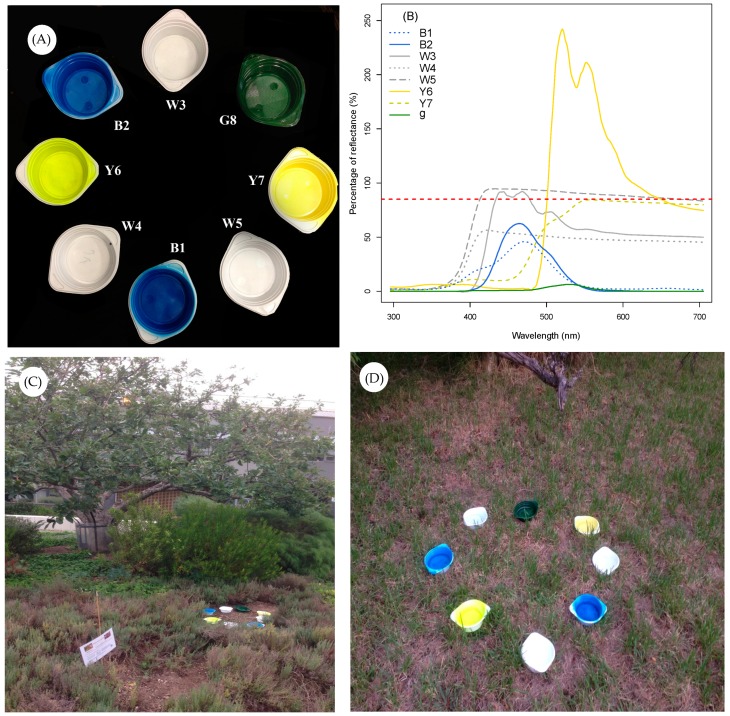
Figure 2.
The pan trap experiment: (A) The pan trap bowls with eight different human perceived “colours”, (B) the percentage of reflected radiation plotted against wavelength for each pan trap “colour” type (See Table 1 for details and the different treatments involved for each pan trap type). The red dotted line shows the 90% threshold for categorisation as fluorescent or non-fluorescent stimuli, (C,D) the pan traps in the sample field settings.

