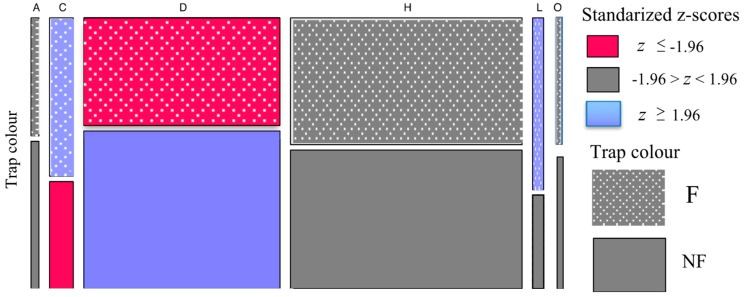
Figure 3.
The mosaic plot shows the frequency of captures of the different insect types/order (coded with the following alphabetic letters for each group. H: Hymenoptera, D: Diptera, L: Lepidoptera, C: Coleoptera, O: Orthoptera, and A: Araneae. See Table 2 for details) for pan trap types classified as either fluorescent or non-fluorescent. The box width represents the proportion of captures for each insect order, whilst the box height is an indicator of the proportions of capture by the fluorescent pan traps (upper row dashed pattern) and the non-fluorescent traps (lower row solid pattern). The colour indicates the z-values for the respective standardized residuals (Table 2): blue indicates a significant preference for stimuli, red indicates that the stimuli collected significantly less individuals, and grey indicates the capture rate was not significantly different to the chance expectation (null condition). F = Fluorescent, NF = Non-Fluorescent.

