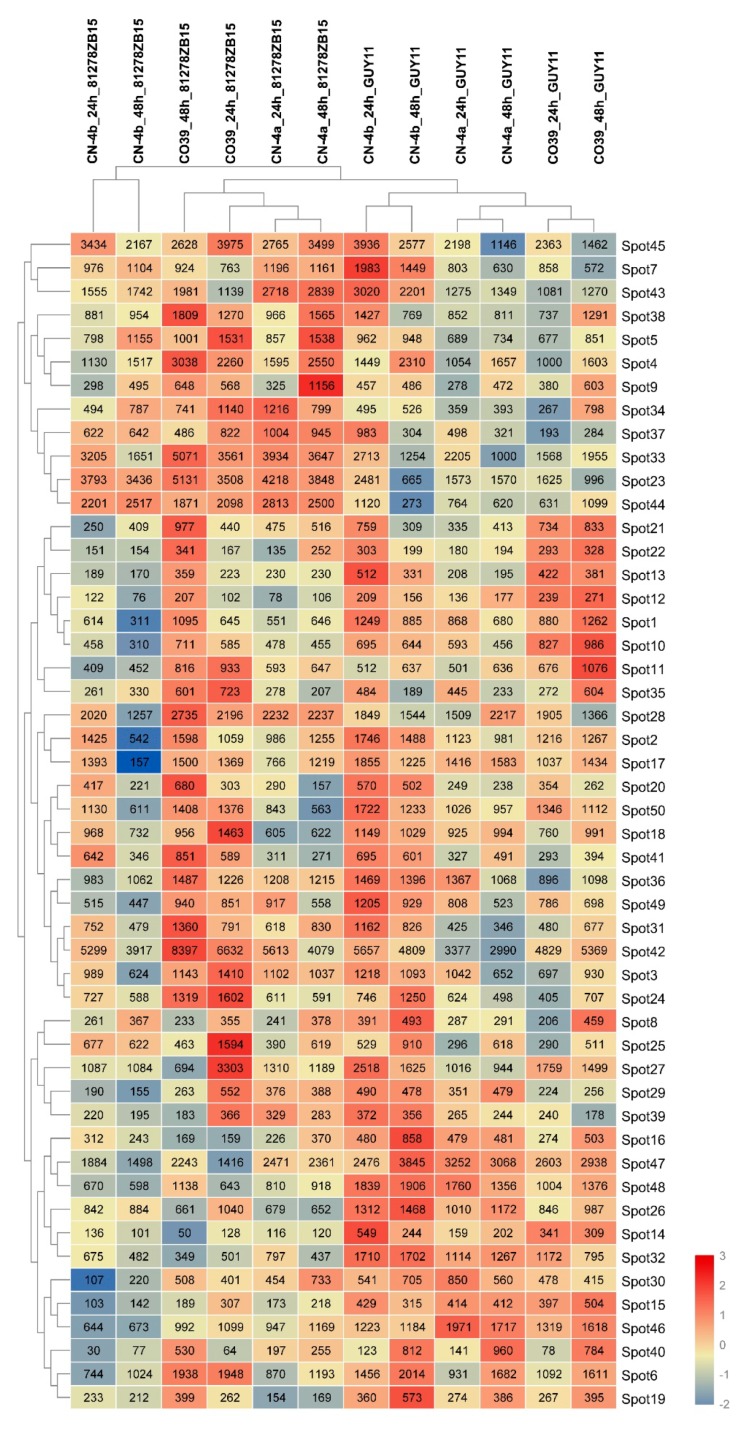
Figure 5.
Heat map of expression pattern of DEPs in the three test rice cultivars at 24 and 48 hpi of different fungal isolates. According to different samples, the DEPs were grouped into two clusters, one was GUY11 and the other was 81278ZB15. Based on the similarity of the expression level, protein spots were separated into two clusters, the upper one contained spots from spot 45 to spot 44. CN-4a_24h_81278ZB15 or _GUY11: CN-4a at 24 hpi of 81278ZB15 or GUY11, CN-4b_24h_81278ZB15 or _GUY11: CN-4b at 24 hpi of 81278ZB15 or GUY11, CO39_24h_81278ZB15 or _GUY11: CO39 at 24 hpi of 81278ZB15 or GUY11. The same below.

