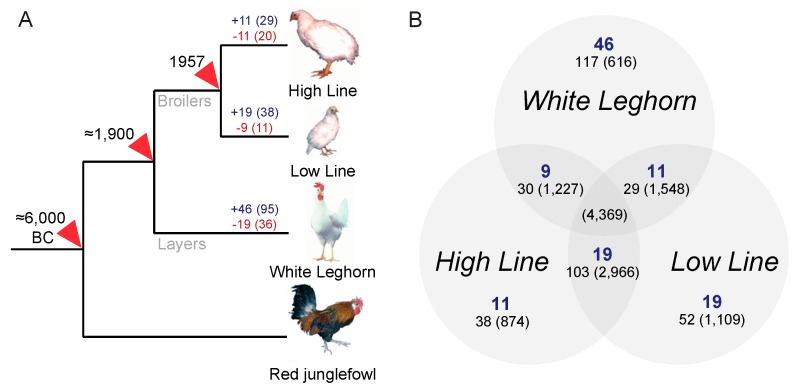
Figure 1.
Chicken selection lines and ERV variation. (A) Phylogeny of analyzed fowl modified from Rubin et al. [18]. Blue numbers above branches indicate candidate branch-specific ERV insertions and red numbers indicate candidate branch-specific missing ERVs at the analyzed loci, see Table 2. Numbers in brackets indicate ERV-associated host genes. (B) Venn diagram showing distribution of identified candidate ERV differences across the domestic chicken selection lines. Blue numbers indicate counts of ERVs only found in the respective chicken line adjacent to genes. The numbers below represent the number of candidate loci after correction for multiple testing, see Table 2, and numbers within brackets show the corresponding number of candidate loci before correction.

